The “Illiquidity” Premium – Fact or Fiction?
Microcaps are often described as “illiquid” – we look at what that actually means, how liquidity has varied over time and how it has impacted returns.

Microcaps are often described as “illiquid” – they are too small to actually buy and sell.
This can be an issue for large funds with billions under management, but for the retail investor, with much less capital to manage, “illiquidity” is not so much of a barrier.
In academic circles, the “illiquidity premium” is often credited as one of the drivers in microcap outperformance (over those periods where they do outperform), being less efficient than their large cap cousins.
But what does “illiquid” actually mean? It can be measured or defined in different ways, but one tangible way to measure how much volume a stock trades.
For perspective – US large caps trade about $150M per day. When you compare this to microcaps, daily volume is a percent of a percent of large caps, not even registering on the same scale.
I shared the graph below in my recent presentation “Uncovering the Edge in Canadian Microcaps” to illustrate the difference.
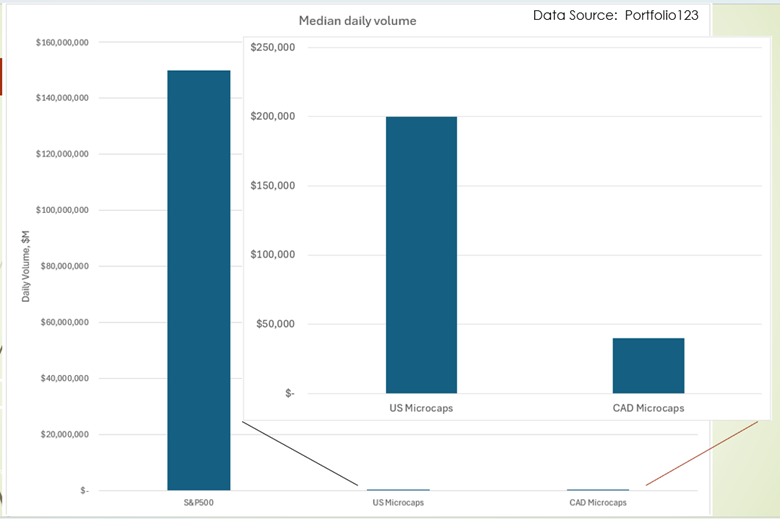
Where US microcaps trade at 0.1% the volume of S&P500 stocks, and Canadian microcaps even less.
We will analyze the MC-Guts Universe defined as all microcaps >$10k vol, >$0.1 share price, excluding financials and utilities. This is also the universe of companies we screen quantitatively for our MicroCapGUTS Index.
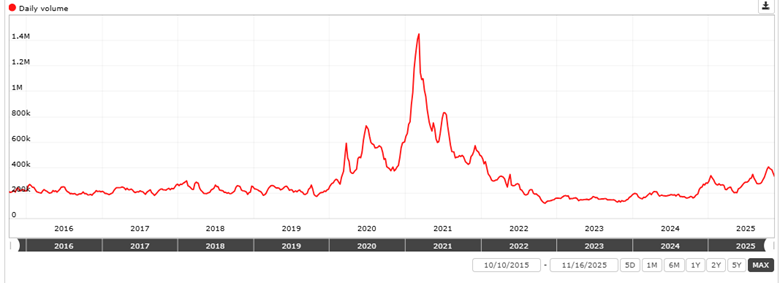
Liquidity varies over time, sometimes significantly. The plot below shows median daily volume ($) of US MC-GUTS microcaps. Historically these stocks have traded around $200k per day, but note the significant spike during COVID, peaking at over $1.4M, only to fall back to historical levels.
Liquidity is an important aspect in testing factors and strategies as well. If lower limits are too low (i.e. too illiquid), then results can end up being artificially high. For all research and simulations on the Evidence Based Forum at MicroCapClub, I use a minimum of $10k volume per day. For some investors this may be liquid enough, but eventually as capital increases, then higher liquidity is required to buy and sell stocks, even microcaps.
So let’s dig into microcaps, and look more closely at liquidity.
The table below takes our MC-GUTS US universe, and breaks down the number of stocks into liquidity groups, as measured by median daily volume.
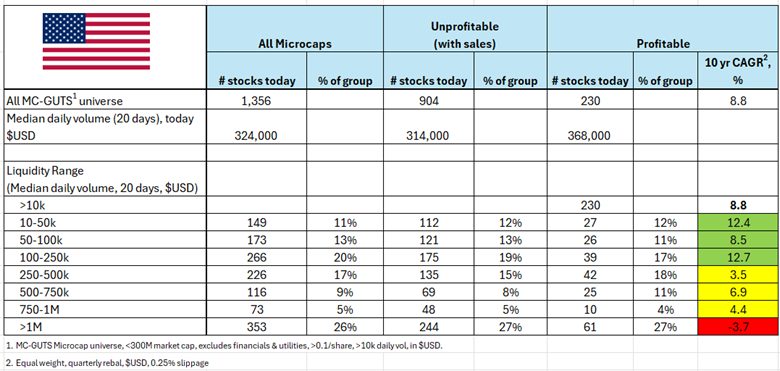
As of today, the median trading volume of US microcaps (over 20 days, or 1 month) is $324k (first column). About 75% of all microcaps trade less than $1M per day, but still 25% over $1M is meaningful.
Microcaps are unique to large caps in that they may be pre-revenue, or even not yet profitable. For further insight, the next two columns look at microcaps that are unprofitable (with sales), and those that are profitable. The proportions in both groups are more or less than same as the “all microcaps” group.
The right-most column shows performance (10 year annualized) of each liquidity group for profitable microcaps. Notably – the least liquid stocks, or $250k or less, have outperformed. Stocks with more than $250k in volume have still come out positive, but underperforming the less liquid stocks. And the most liquid microcaps, with trading volume of $1M or more – have provided negative returns.
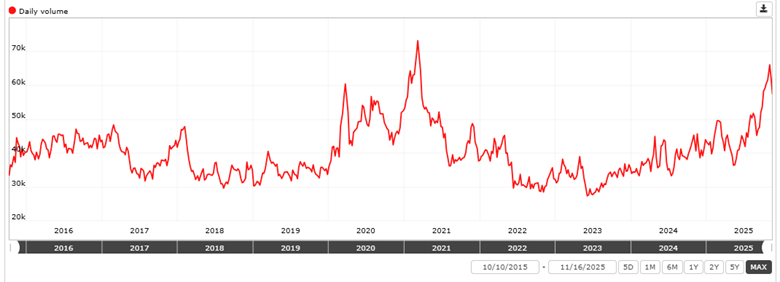
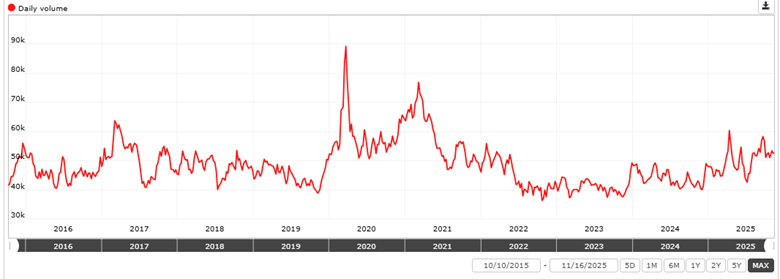
Recall from the bar graph above that Canadian microcaps have even less daily volume than US microcaps. The plot below shows median volume over the last 10 years for MC-GUTS Canadian microcaps. The historical median is roughly $40-50k, with a spike during COVID (although not as extreme compared to the US), and has been trending upwards in 2025.
And Canadian MC-GUTS microcaps broken down today into different liquidity groups:
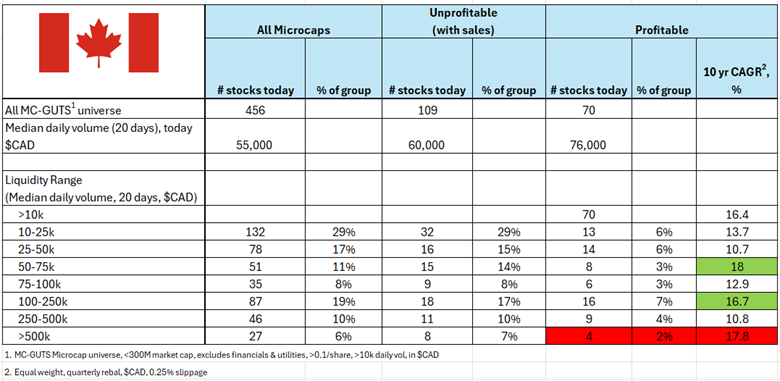
We see the flipside in terms of liquidity distribution in Canadian microcaps, with nearly 30% of stocks in the smallest group ($10k-$25k).
Also notable here with Canadian vs US microcaps is the consistency in returns of the profitable group – where the full universe of profitable stocks have had a return of 16.4%, all other liquidity groups have still returned in the double digits.
(Note: The number of liquid Canadian microcaps with more than $10K in daily volume is substantially less than for US microcaps, so our samples size are smaller and may not be a direct comparison to US microcaps in this case. The $500k+ group in particular is very small, and results are very volatile (highlighted red)).
And when it comes to European microcaps, the historical median volume has been around 50k Euro, with a slight peak 2019 thru 2021.
And European MC-GUTS microcap broken down:
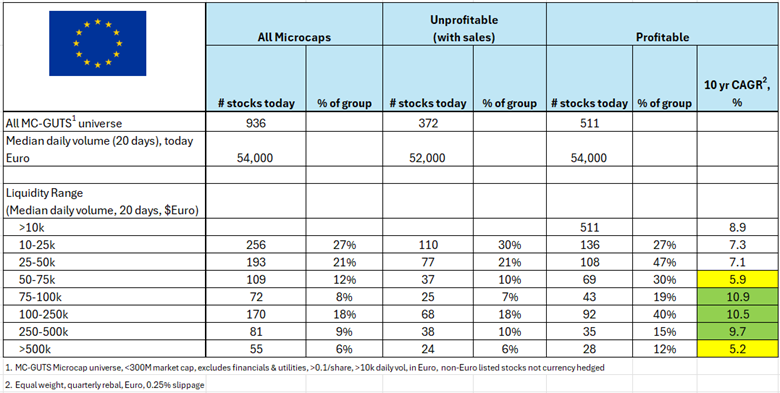
Profitable European microcap returns have been fairly consistent across liquidity groups, the highest performing from 75k to 500k range, and all in positive territory.
The Illiquidity Premium – Fact or Fiction?
Like many things – it depends – on how you measure liquidity, and then further how you define what is illiquid and what isn’t.
Liquidity varies by region for microcaps, and can impact some regions more than others (i.e. the more illiquid the better for US profitable microcaps, but less so for Canadian and European), and it can vary over time, at times significantly.
We have looked generally at profitable microcaps, but performance can vary by liquidity by different types of microcaps and their different factors.
Another related aspect of microcaps is market impact – for an investor making sizeable investments of a microcap, the buy or sell alone can move the stock, which we have not taken into account here. There are ways to estimate market impact, which may be the subject of a future piece.
If you enjoyed this article, I've written 30+ microcap evidence based papers on the MicroCapClub Community here.
Interact and learn with 250+ of the best microcap investors on the planet:
Portfolio123 – All data and quantitative tools used for this piece, and all pieces in the Evidence Based Forum, provided by Portfolio123. If you’d like to try Portfolio123 with an extended free trial (35 days vs the typical 20 days), check out this link, or use Invitation Code “RYANT” (full disclosure, affiliate link). I’m available for any questions you may have.
Note: Past performance is not an indicator of future results. Please visit our Terms of Use for a more complete disclaimer and discussion of the risks of investing.
MicroCapClub is an exclusive forum for experienced microcap investors to share and discuss microcap companies (sub $1 billion market cap) trading on global markets. Since 2011, our members have profiled 1400+ microcap companies, 300+ have turned into multi-baggers. Investors can join our community by applying to become a member or subscribing to gain instant access. For more information, visit https://microcapclub.com/
Disclaimer: All content in this newsletter is for discussion, education, entertainment, and illustrative purposes only and SHOULD NOT be construed as professional financial advice, solicitation, or recommendation to buy or sell any securities, notwithstanding anything stated on this newsletter and MicroCapClub.com. There are risks associated with investing in securities. Loss of principal is possible. Past performance is not a predictor of future investment performance. Ian Cassel and MicroCapClub.com are not responsible for investment actions taken by viewers. Should you need such advice, consult a licensed financial advisor, legal advisor, or tax advisor. You agree to verify all information yourself before investing. Any past performance discussed on MicroCapClub.com is no guarantee of future results. Investing involves risk and possible loss of principal capital; please seek advice from a licensed professional. All views expressed are personal opinions as of the date of publication and are subject to change without the responsibility to update views. No guarantee is given regarding the accuracy of the information. FULL DISCLAIMER and TERMS OF USE





Comments
Loading comments…