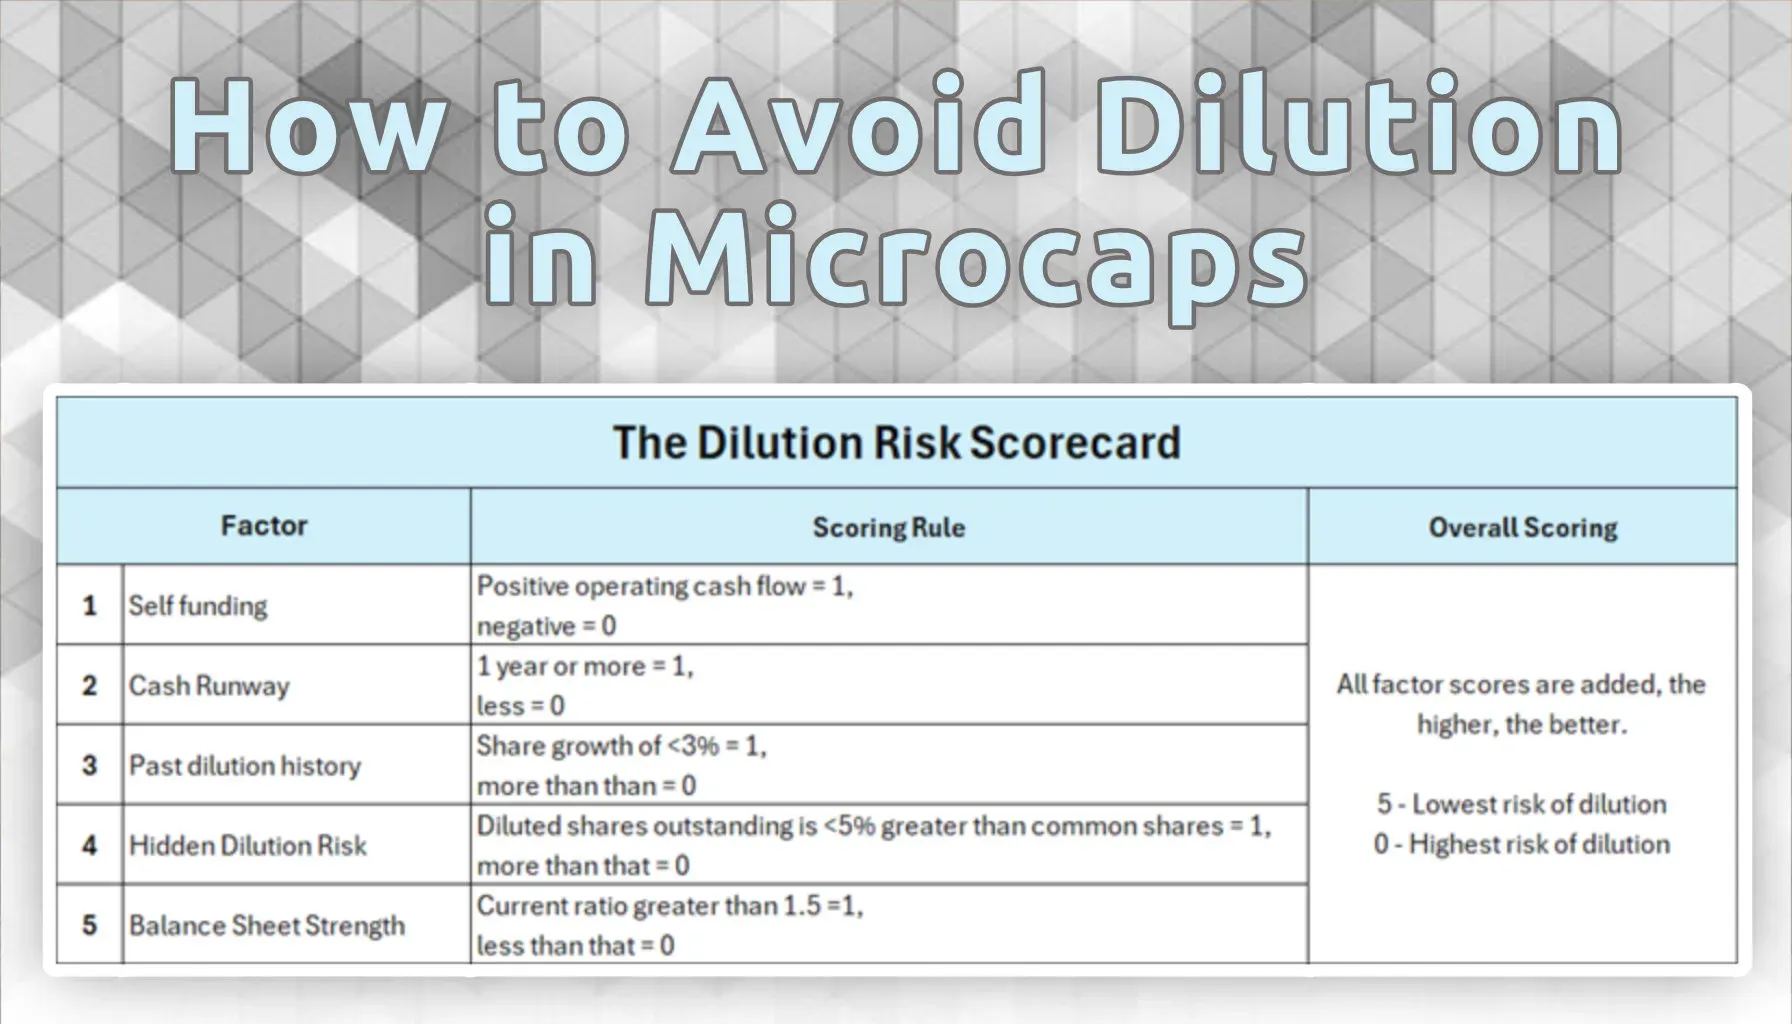
How to Avoid Dilution in Microcaps - A Dilution Risk Scorecard
We can predict future microcap equity dilution and equity dilution can predict future returns.
Companies need capital to operate and grow.
Capital can come from various sources, from internal resources (i.e. a company generating enough cash to operate), new debt, or new equity, among others.
Many microcaps rely on equity as their capital source for many reasons. As we’ve seen in previous pieces, only a fraction of microcaps are profitable or cash flow positive to be self-funded, and in many cases microcaps do not have a sufficiently strong balance sheets to acquire new debt.
For this reason, equity is a common form of capital for many microcaps.
All sources of capital have their unique pros and cons. When it comes to equity, one of the most negative cons is dilution. As a microcap acquires new equity, the total share count must increase (as the company are essentially selling more shares to the market), which “dilutes” any current shareholders.
As a simple example, assume a microcap with $1000 in earnings, distributed across 1,000 shares, or $1.00 of earnings per share. The company sells 200 shares to the market, and now that $1,000 of earnings is spread across 1,200 shares, or $0.83 earnings per share. Current shareholders have been “diluted”, and a corresponding drop in share price usually follows.
Dilution is a common occurrence in microcaps, and can be a frustrating experience to see one of your microcaps drop 10-30% as it acquires new shares.
But not all is lost – there are usually signals that a company may be at risk of requiring new equity, which can be predicted months in advance.
We’ll look at some specific factors to help us, in what I call the “Dilution Risk Scorecard”.
Microcap Capital Structure
Before getting into dilution, understanding capital structure can provide some good context. Microcaps are fundamentally different than their large cap cousins, and even within microcaps properties can vary significantly across different geographic regions.
Equity is essentially a component of a company’s capital structure, which is typically combined with some level of debt (but not always). Below is a chart of the ratio of equity to debt (the inverse of the more common debt-to equity ratio) for our MC-GUTS Microcap universes, along with the S&P500 for large caps.
Canadian Microcaps stand out as the most equity financed microcaps consistently over time, ramping up to about 10:1 equity-to-debt in 2022, and settling down to about 6 to 7 today. Perhaps this is not surprising, with a majority of Canadian microcaps being in capital intensive industries such as mining and energy production. US Microcaps show a similar trend peak in 2022, but at a much lower level and at 4 today. European microcaps have even less equity in their capital structure, with a 10 year median of around 2-3. This will be key to remember for later.
And for comparison – US large caps (as measured thru the S&P500) have historically had a ratio of equity to debt of just over 1.
And these are median values over time – as we will see, these values can vary widely between individual microcaps.
Microcap Dilution Over Time
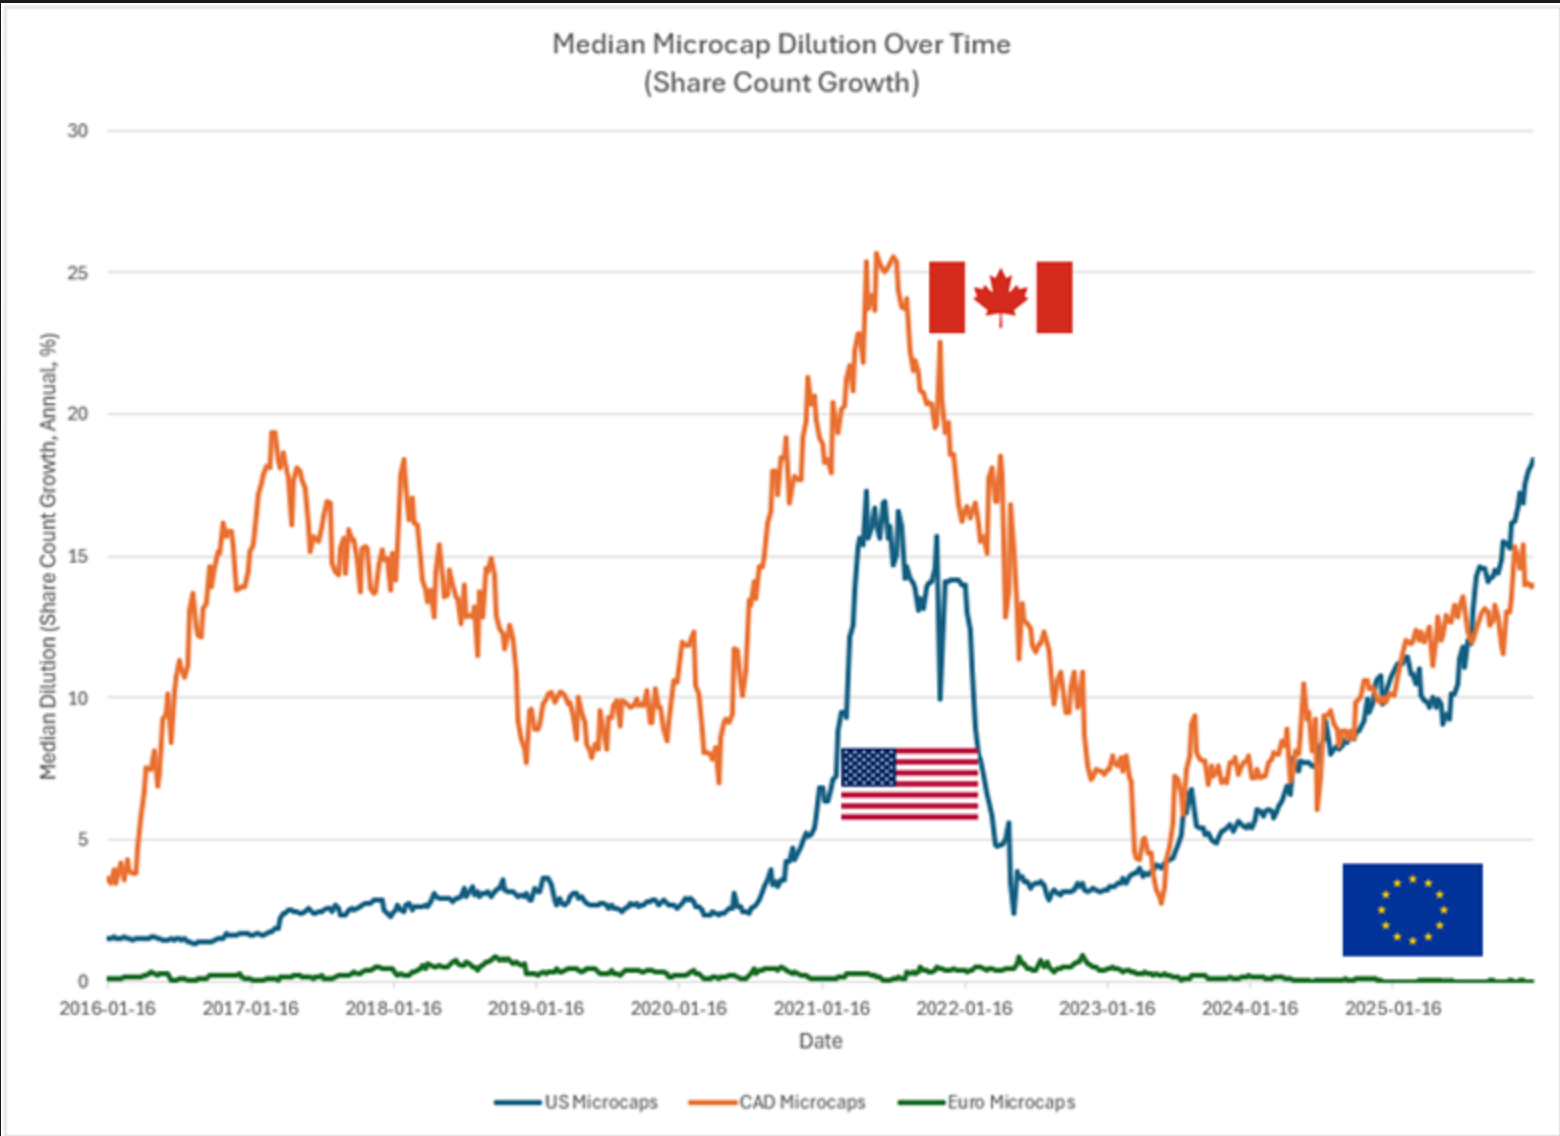
Now with a view on how microcaps are structured, we can look more closely at dilution over time with some context. Below is a plot of dilution, as measured by increase in share count growth, for the same microcap groups above.
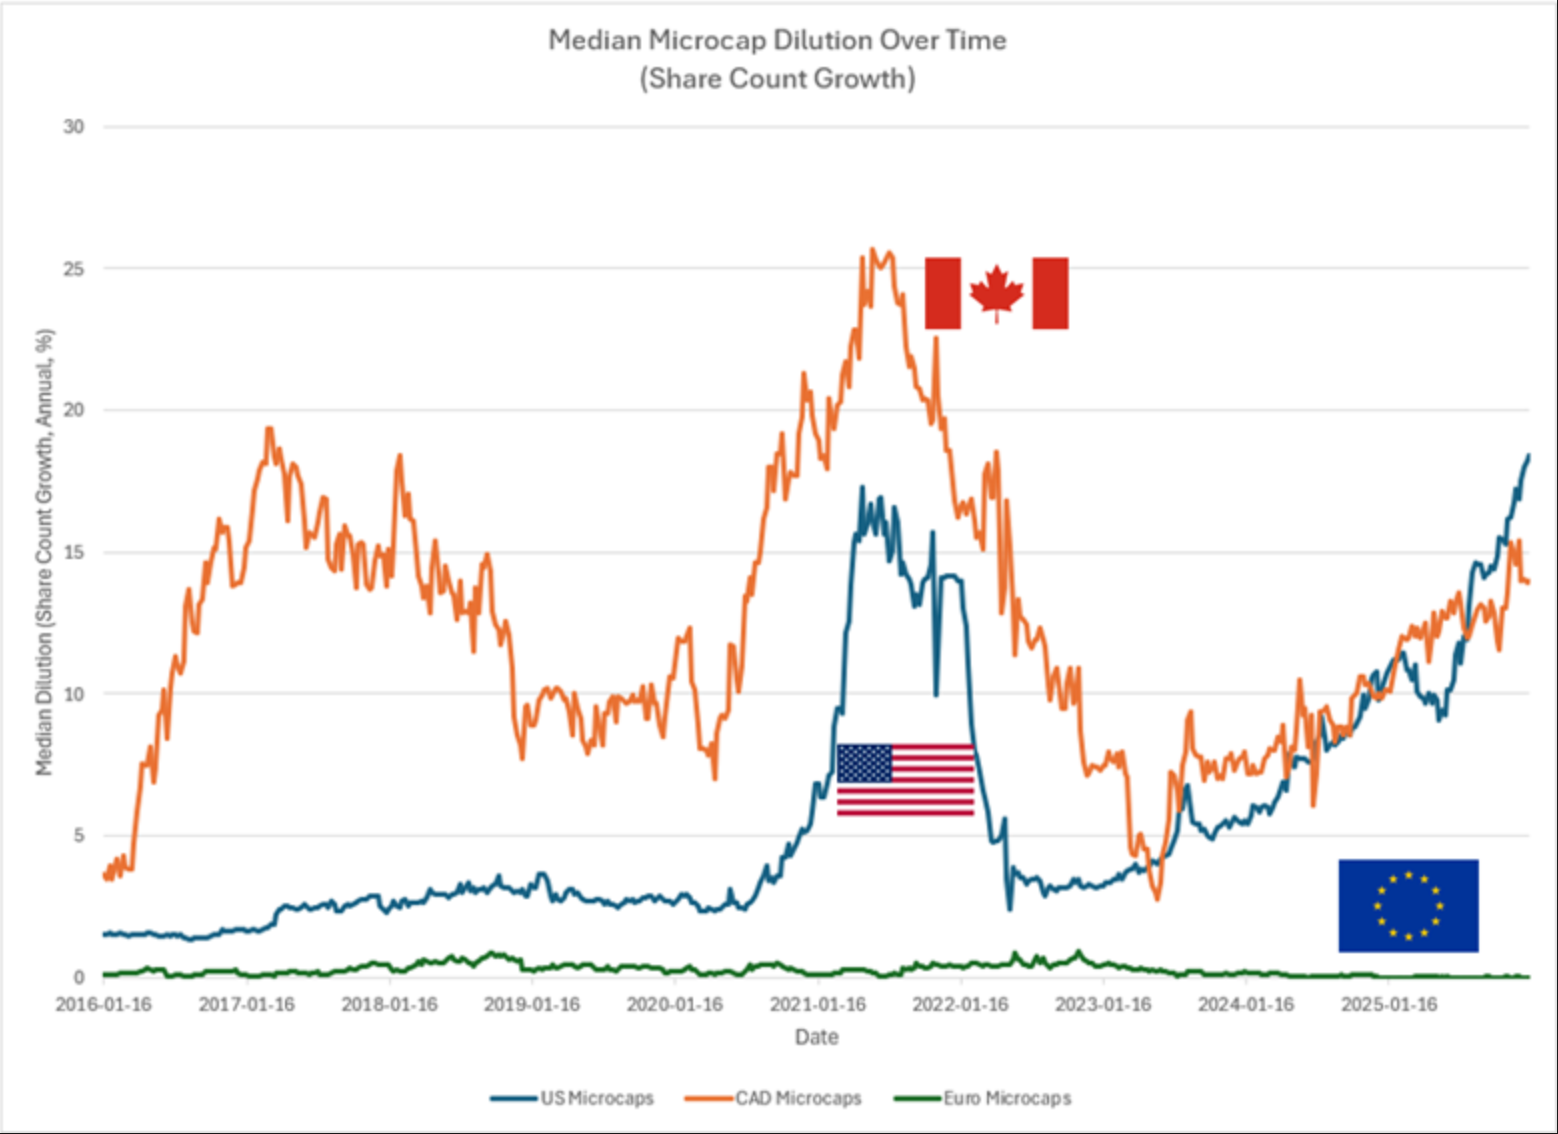
We see similar trends across our regions between dilution and capital structure. Canadian microcaps are financed more by equity, and similarly have the highest amount of dilution over time, peaking at 25% in 2022, dropping to a single digit low in 2023, and ramping up again to today. US Microcaps have had more of a stable dilution rate, other than a peak in 2021/22, but since the dilution bottom in 2022 has steadily been increasing from a low of about 3 to a peak today of 18.
And European microcaps – their dilution rates barely register on this scale, compared to Canadian and US Microcaps. There can be different reasons for this, mostly due to their capital structure with lower equity, but also in some quick research European companies tend to view dilution very differently than their North American counterparts. Keep this in mind for the later sections.
The Dilution Risk Scorecard
Dilution is arguably one of the most destructive forces in investing, but can investors avoid it in advance?
With some understanding on how microcaps are financed, we can look at some key criteria to help assess a microcap’s risk of future dilution.
I’ve looked at various factors, and combined the following into what I call the Dilution Risk Scorecard.
- Self-funding – is the stock able to fund its operations internally? Positive operating cash flow will be our positive signal.
- Cash runway – the faster a company is burning thru its cash, the sooner it is likely to need additional capital. A cash base of more than 1 year is preferred.
- Past dilution history – has the stock diluted before? This can be a strong signal on its own. Little to no previous dilution is preferred.
- Hidden dilution risk – When the fully diluted share count is rising faster than basic shares, it can indicate growing convertible or warrant overhang — a strong early warning that dilution is likely before it shows up in reported share counts.
- Balance Sheet strength – Access to debt is limited by the strength of a stock’s balance sheet. A weak balance sheet often means that capital must be sourced from equity.
Below is our Dilution Risk Scorecard.
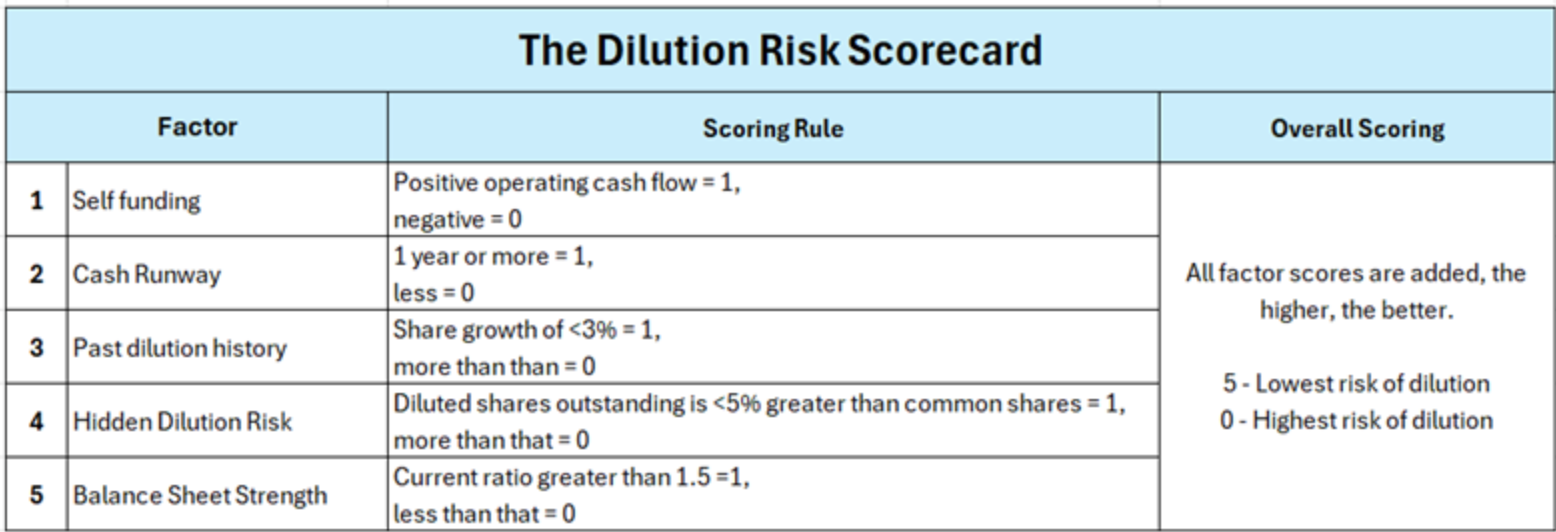
All scores are added up for each stock, the higher the score, the better.
Using the Dilution Risk Scorecard to Predict Dilution
Now let’s see how effective our Dilution Risk Scorecard has been at predicting dilution.
The table below shows the breakdown of all US microcaps today, based on the Dilution Risk Score. Future dilution is also shown at various cut-off dates to see how well each score has predicted dilution.
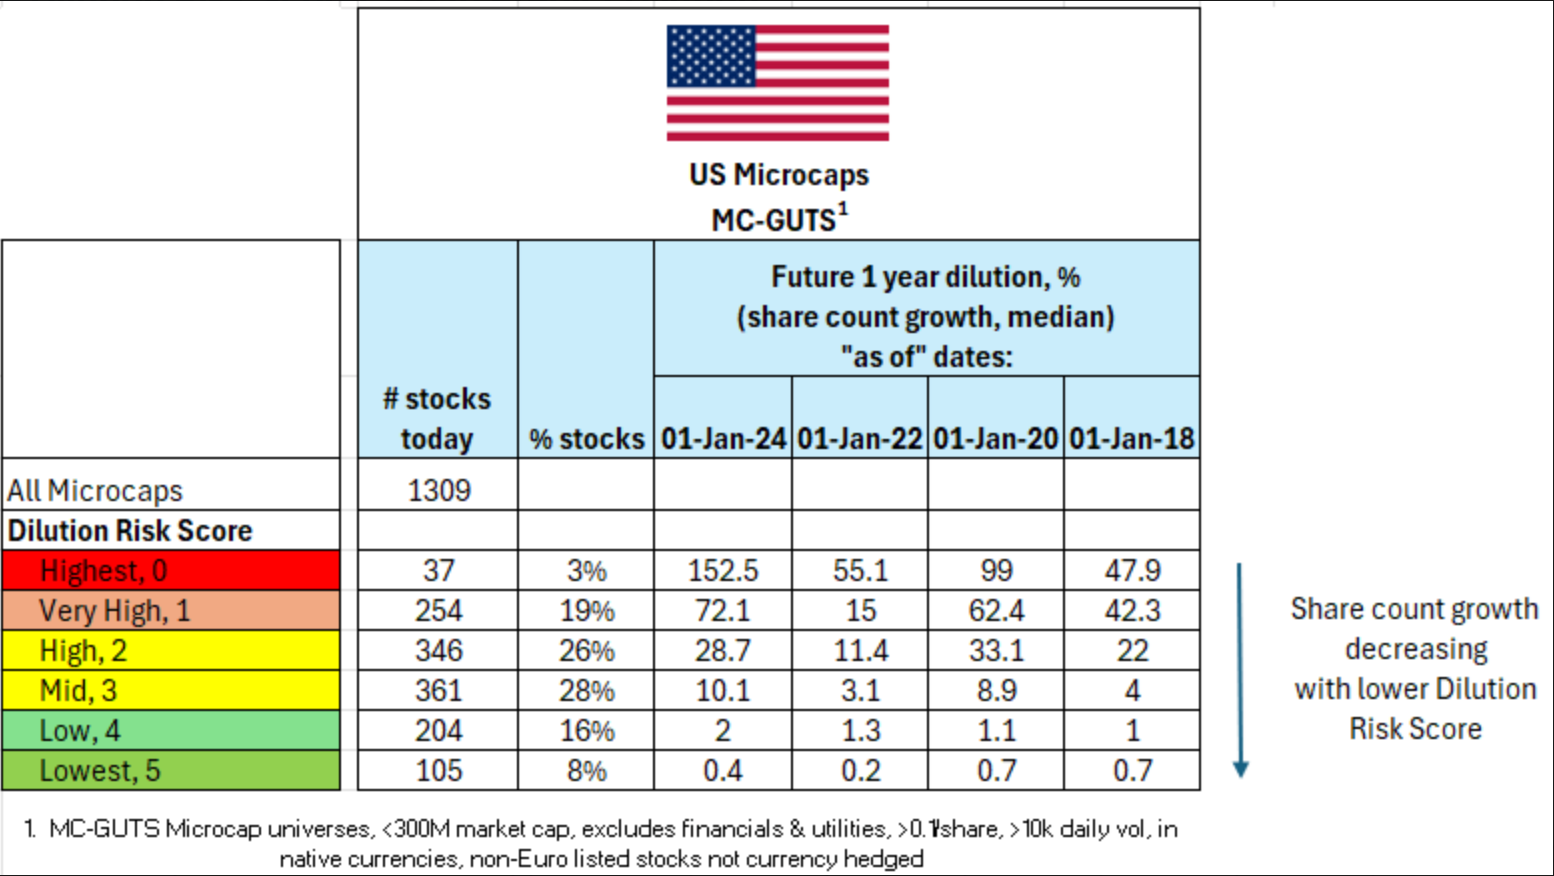
As of today, more than 50% of US microcaps have middling dilution risk scores, with higher and lower risk stocks at the fringes.
Most importantly from this table, we see how the score has predicted future 1 year dilution – the higher the risk (lower score), the higher the future dilution has been, when tested over the 4 years 2024, 2022, 2020 and 2018. This is exactly what we want to see.
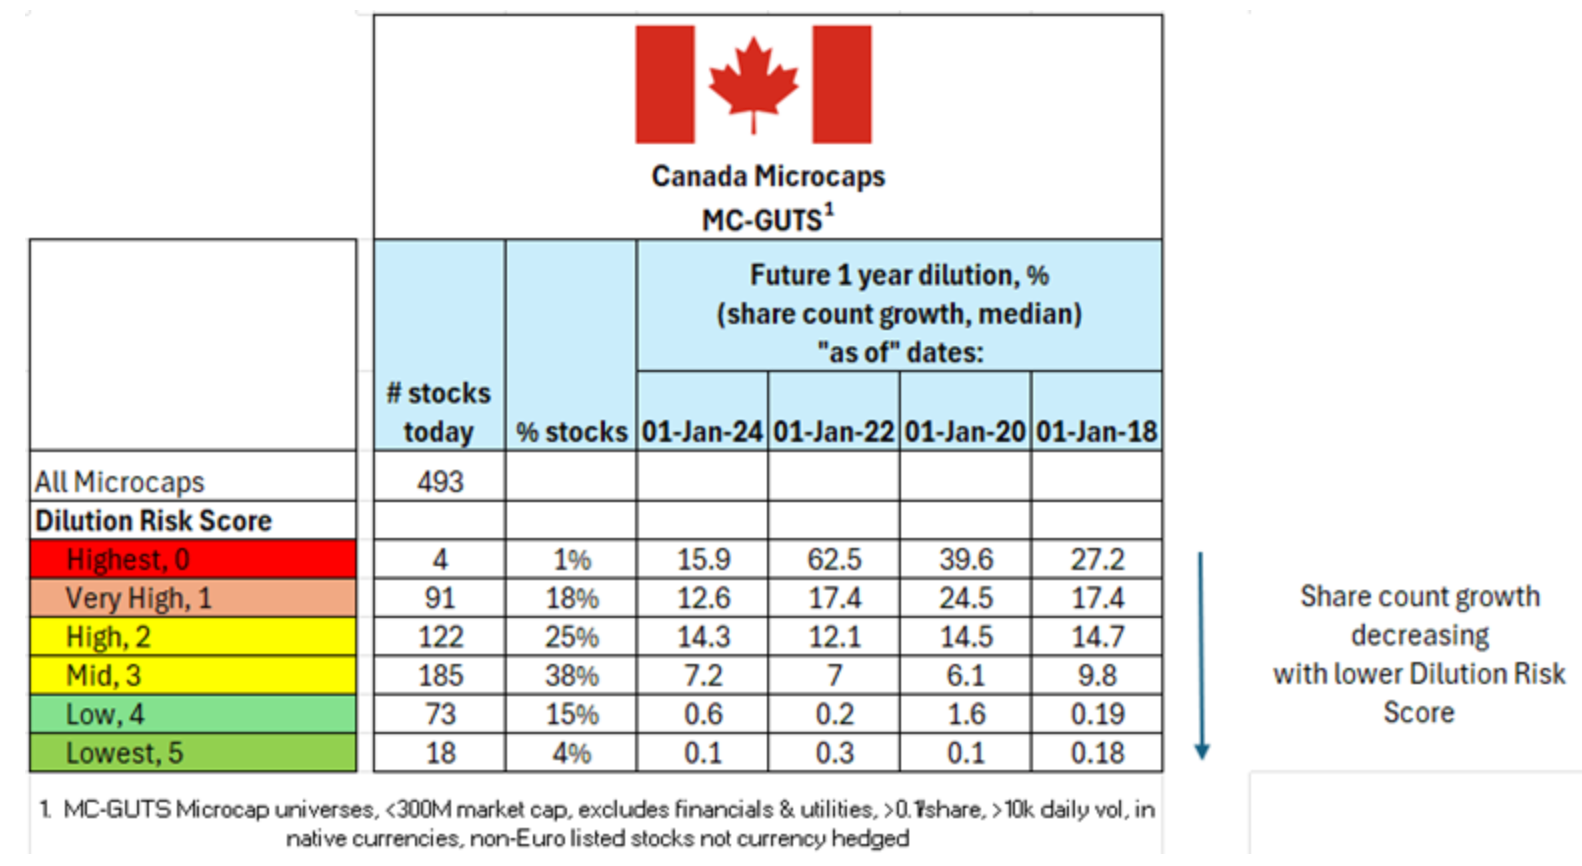
And for Canada, we see the same trend – the higher the dilution risk, the higher the future dilution.
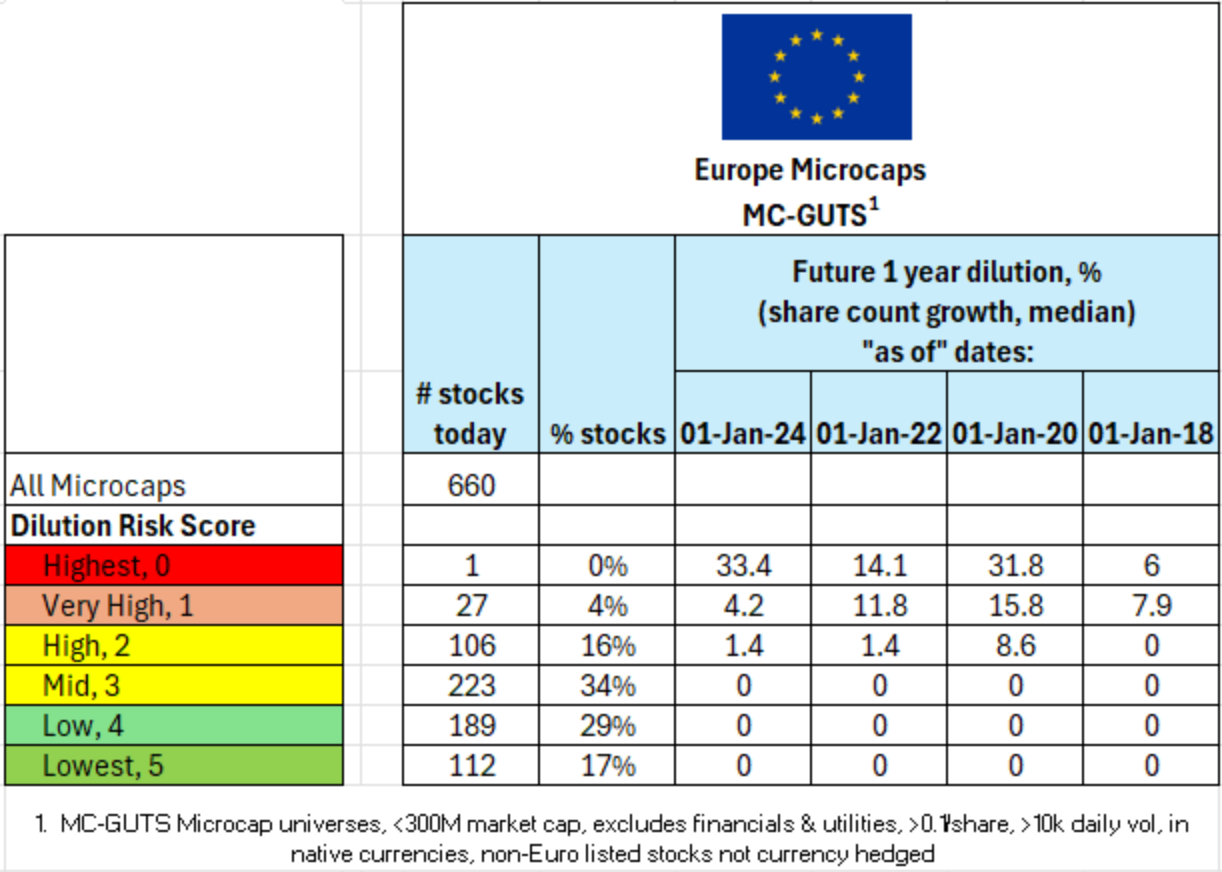
Recall from the charts earlier that European microcaps have very different equity and dilution characteristics compared to US and Canadian microcaps. Below is the same table with scoring and future dilution rates for European microcaps, but not surprisingly based on the earlier charts, we see zero future dilution at the higher scoring stocks. This suggests that the dilution score may not be as effective with European microcaps (as dilution is not as much of an issue in the first place).
Using the Dilution Risk Scorecard to Predict Future Returns
So if the Dilution Risk Score has been able to predict future dilution, can it predict future returns? Below is a summary of 10 year annualized returns of our various Dilution Risk score groups for US and Canadian microcaps.
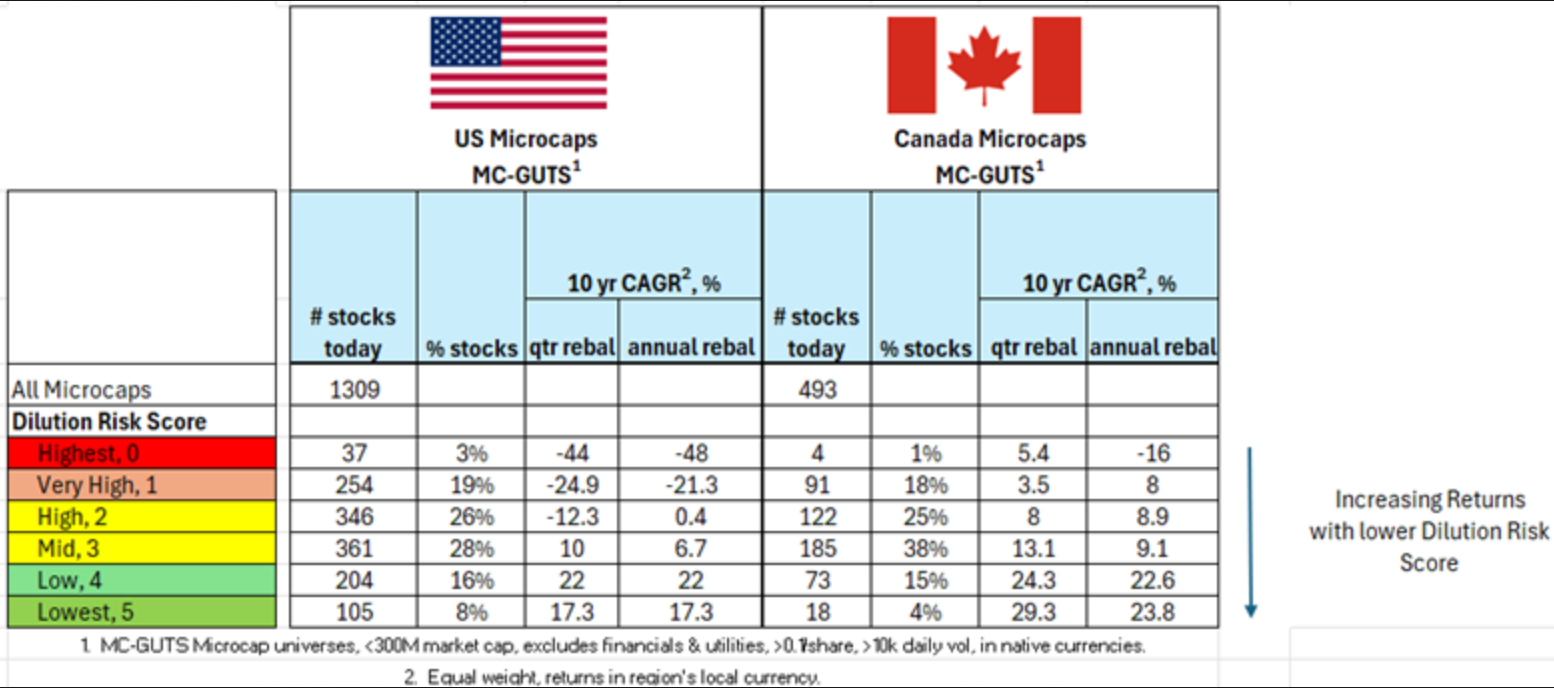
As we saw with future dilution, the Scorecard groups have been able to predict future returns as well – the lower the dilution risk score, the higher the returns. The only exception is with lowest dilution risk US microcaps (score 5), which has slightly lower returns than the low (Score 4) stocks.
These are positive results – dilution is value destroying for existing shareholders, and being able to predict it before it happens can help avoid some potential blowups.
Dilution is Predictable
Dilution in microcaps is often viewed as unavoidable, but the evidence suggests it follows a pattern. The need to issue equity is typically driven by cash burn, limited balance-sheet flexibility, prior dilution behavior, and growing hidden dilution pressure — all of which can be observed well before new shares appear.
The Dilution Risk Scorecard brings these signals together using only standard financial statement line items and widely available Portfolio123 functions. It requires no forecasts or discretionary judgment, making it transparent, testable, and repeatable. Across U.S. and Canadian microcaps, the score shows a clear relationship with both future dilution and long-term returns: companies with higher dilution risk go on to dilute more, and those that dilute more tend to deliver weaker shareholder outcomes.
Avoiding dilution does not guarantee success, but repeatedly owning equity-dependent microcaps almost guarantees disappointment. In markets where equity is the primary source of capital, managing dilution risk is not a secondary consideration — it is often the difference between compounding returns and permanent capital loss.
If you enjoyed this article, I've written 30+ microcap evidence based papers on the MicroCapClub Community here.
Interact and learn with 250+ of the best microcap investors on the planet:
Portfolio123 – All data and quantitative tools used for this piece, and all pieces in the Evidence Based Forum, provided by Portfolio123. If you’d like to try Portfolio123 with an extended free trial (35 days vs the typical 20 days), check out this link, or use Invitation Code “RYANT” (full disclosure, affiliate link). I’m available for any questions you may have.
Disclaimer: All content in this newsletter is for discussion, education, entertainment, and illustrative purposes only and SHOULD NOT be construed as professional financial advice, solicitation, or recommendation to buy or sell any securities, notwithstanding anything stated on this newsletter and MicroCapClub.com. There are risks associated with investing in securities. Loss of principal is possible. Past performance is not a predictor of future investment performance. Ian Cassel and MicroCapClub.com are not responsible for investment actions taken by viewers. Should you need such advice, consult a licensed financial advisor, legal advisor, or tax advisor. You agree to verify all information yourself before investing. Any past performance discussed on MicroCapClub.com is no guarantee of future results. Investing involves risk and possible loss of principal capital; please seek advice from a licensed professional. All views expressed are personal opinions as of the date of publication and are subject to change without the responsibility to update views. No guarantee is given regarding the accuracy of the information. FULL DISCLAIMER and TERMS OF USE