10X Microcaps and Multibaggers – What Really Drives High Returns?
I analyze largecap and microcap multi-baggers across three and ten year periods.

The factors that drive short term and long term microcap outperformance are quite different.
When it comes to those factors that really drive stock returns, there are many opinions – earnings growth, multiple expansion, buybacks/dividends, sentiment, and many more.
In reality, nailing down exactly how much of a stock’s return is driven by a given factor can be difficult.
That said, using some algebra, it is possible to determine how a few broad factors have driven returns of any stock over time, and in what proportion.
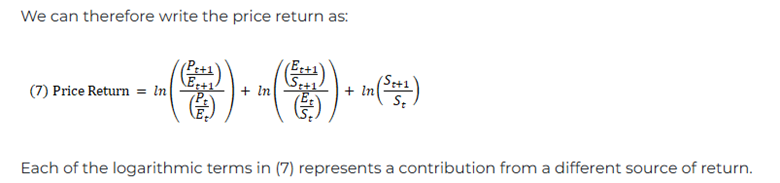
I touched on this subject in my Keynote speech at the April MCC/Planet Microcap conference [VIEW HERE]. In this post I would like to expand on some of those key ideas and principles.
Of particular interest is Appendix B in the aforementioned piece, “The Mathematics of Return Decomposition”, where the OSAM team show the algebra behind a stock return, and how it can be broken down into its individual drivers – earnings growth, multiple expansion, and dividends.
Or perhaps more intuitively:
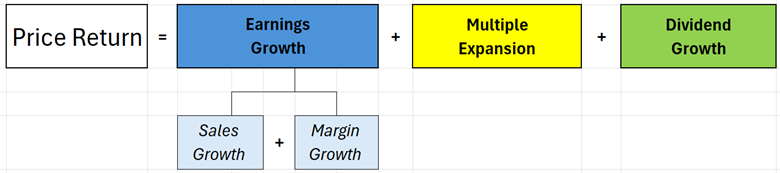
It is important to note that price return can be broken down into different drivers, provided that the algebra works out (i.e. numerators and denominators balance properly, see the OSAM Appendix B for more details). Perhaps I will look at other variations in the future.
The table below shows a few examples of large cap US stocks that have returned more than 5X in the last 10 years, and the main return driver can vary across different stocks.
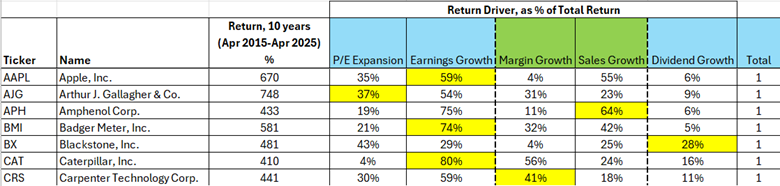
In the case of AAPL, AIG, BMI and CAT, the main drivers over the last 10 years have been earnings growth. We can break earnings growth down further, and see how margin growth and sales growth have contributed – notable in APH’s case, the earnings growth was driven mostly by sales growth.
Of these select stocks, P/E expansion and dividend growth have been the minor contributors, with the exception being BX, with 43% and 28% respectively.
These are some large cap multibaggers, now let’s look at microcaps.
Microcap Multibaggers
With our return driver framework, we can look at some microcap multibaggers, and see how our returns drivers have contributed to their returns.
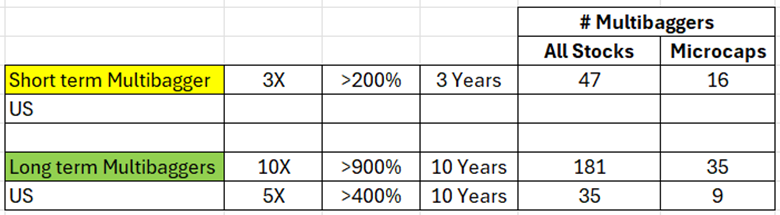
For different perspectives, we will look at both short term and long term multibaggers:
- Short term multibagger: >3X over 3 years
- Long term multibagger: >10X over 10 years
We are only looking at multibaggers that have retained their returns; any “roundtrippers” that may have 3X’d within 1 or 2 years, but then returned to their starting point are excluded. We are also looking at profitable stocks only, so we can compare starting and ending P/E ratios (as noted above, only profitable stocks can have P/E ratios)
The table below provides some stats on multibaggers, and the proportion of those starting out as microcaps.
From our sample, a higher proportion of microcaps have made “short term multibagger” status (about 33% of all stocks), however fewer long term multibaggers started out as microcaps (20-25%).
Multiple Expansion
Multiple Expansion is essentially a value driver – a stock bought at a P/E of 10, and then rising to a P/E of 20, is a 2X return on its own.
Multiples can vary over time (particularly for microcaps), from swinging wildly to either the positive or negative, or even staying flat for several years.
The graph below plots the median P/E ratio for all profitable microcaps (as only profitable stocks can have a P/E ratio) in our US MC-GUTS universe, over the last 10 years.
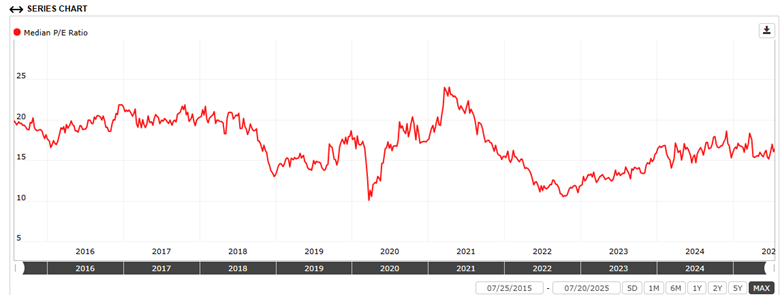
Over the last 10 years, US profitable microcaps have had a median P/E ratio of around 15. But notable here is that any change in P/E is highly dependent on buy and sell points. For example, there was little to no multiple expansion for the group from 2015 to 2018, with the P/E ratio more or less flat at 20.
But if one bought near the bottom of COVID (P/E of 10), and sold within a year at the peak in 2021, multiples expanded nearly 250% (10 to 25). Or if taking a very long term position – the group bought in 2015 at P/E of 20, and held until today, would have seen P/E contraction from 20 to 15. Timing these entry points, based on P/E or valuation, can be very difficult.
For comparison, here is the same median P/E graph for the S&P500 over the last 10 years:
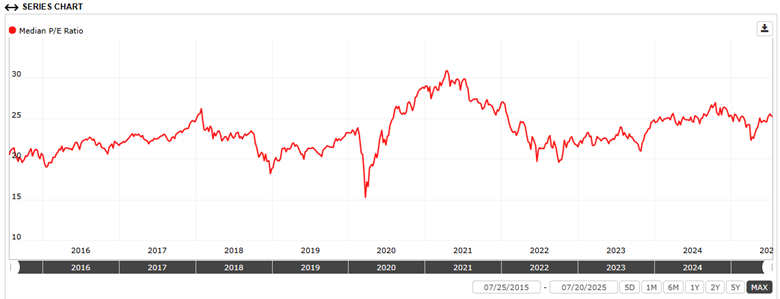
While we still see some P/E extremes from the COVID bottom to the peak, the P/E has remained more stable, around 20-25.
These graphs provide perspective of groups of stocks, but a single stock can show similar trends in P/E over time, and the buy and sell point can make a significant impact on how much (or little) multiple expansion can drive returns.
Short Term Multibaggers
The graphic below takes our short-term multibaggers (>3X in 3 years), and compares the broad group (top) with those starting out as microcaps (bottom).
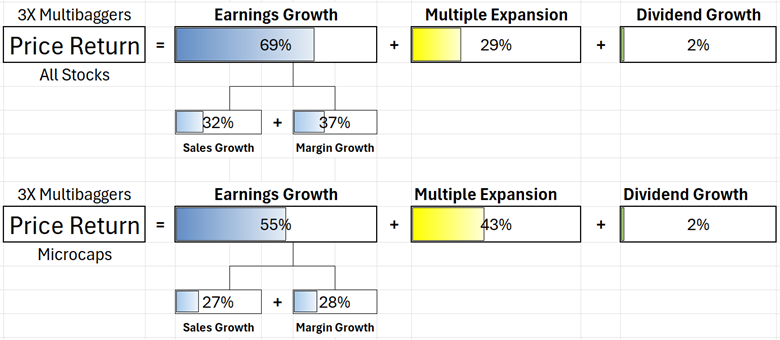
For our “all stocks” 3X multibaggers, the lion’s share of return has been driven by earnings growth (69%), split more or less evenly between sales growth and margin growth.
The microcaps of the group show similar strength from earnings growth, however the return from multiple expansion is notably higher than all stocks (43% vs 29%). When we look at our trend of P/E ratios in microcaps vs the S&P500 above, there has generally been a wider spread in the last 3 years with microcaps. Perhaps if we completed this study in the 3 years 2015-2018 when P/E was mostly flat, it would have been a different story.
Long Term Multibaggers
Below we have return drivers for our 10X stocks in 10 years. For both all stocks (ex. Microcaps) and our microcaps only group, earnings growth has accounted for 90%+ of the returns. Multiple expansion has been a minor contributor only, and in fact for microcaps, has even been outpaced by dividend growth (for more on dividend paying microcaps, see here.
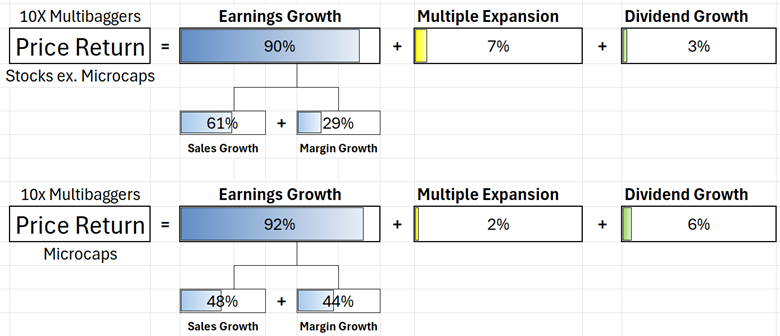
Within our All Stocks (ex microcaps), sales growth was the main driver of earnings growth vs margin growth (61% vs 29% respectively), but it has been more balanced for microcaps (48% vs 44% respectively). Either way, in my travels and speaking to investors, top line sales and growth tends to be underappreciated, with much more focus on bottom line values. But as we see, sales growth has been responsible for ~50% or more of returns in our long term multibaggers.
At least from our sample, with multiple expansion providing such a small proportion of the return, it suggests just how little the value factor has played, over the long term with high performing stocks.
The “Voting Machine” vs The “Weighing Machine”
One of Ben Graham’s most famous quotes describes how the market behaves in the short run vs the long run:
We can extend this idea to our return drivers. “Weighing” can be considered the fundamental growth or performance of a business, i.e. earnings growth. “Voting” on the other hand, could be considered the P/E ratio - what the market is willing to pay for given earnings. And as we have seen, particularly for microcaps, the “voting” can be very volatile in the short run.
If we consider our 3 year multibaggers as “short run”, and 10 year multibaggers as “long run”, then our data is not too far off from Graham’s insight. While we saw earnings growth making up much of the return in our short term stocks, multiple expansion (aka “voting”) played a meaningful role, especially for microcaps.
And for the longer term stocks, 90%+ of the returns were driven by the “weighing machine”, or our earnings growth.
As with all tests, results can vary with differing time periods and stocks, but the takeaway here is that what really drives stock returns (especially for our coveted microcap multibaggers), can also vary. Earnings growth is a key driver, but multiple expansion can have a more meaningful impact over the short run, but can also vary considerably.
Interact and learn with 250+ of the best microcap investors on the planet:
Portfolio123 – All data and quantitative tools used for this piece, and all pieces in the Evidence Based Forum, provided by Portfolio123. If you’d like to try Portfolio123 with an extended free trial (35 days vs the typical 20 days), check out this link or use Invitation Code “RYANT” (full disclosure, affiliate link). I’m available for any questions you may have.
Disclaimer: All content in this newsletter is for discussion, education, entertainment, and illustrative purposes only and SHOULD NOT be construed as professional financial advice, solicitation, or recommendation to buy or sell any securities, notwithstanding anything stated on this newsletter and MicroCapClub.com. There are risks associated with investing in securities. Loss of principal is possible. Past performance is not a predictor of future investment performance. Ian Cassel and MicroCapClub.com are not responsible for investment actions taken by viewers. Should you need such advice, consult a licensed financial advisor, legal advisor, or tax advisor. You agree to verify all information yourself before investing. Any past performance discussed on MicroCapClub.com is no guarantee of future results. Investing involves risk and possible loss of principal capital; please seek advice from a licensed professional. All views expressed are personal opinions as of the date of publication and are subject to change without the responsibility to update views. No guarantee is given regarding the accuracy of the information. FULL DISCLAIMER and TERMS OF USE