The Excessive History of Microcaps
An alternative lesson to draw from his study is that microcaps are fine but nanocaps are the ticket to wealth; you just have to be poor enough to buy them.

Smaller company stocks outperform larger ones. This is one of the chief attractions for investors to small-cap companies and microcap stocks in particular. In the best-selling book, What Works on Wall Street, author James O’Shaughnessy and Founder of O’Shaughnessy Asset Management, confirms from study of historical returns that indeed small caps do outperform large caps by a couple of percent a year. He quibbles with other studies, however, that show microcaps, represented by the smallest decile of the market, outperform small caps significantly. He notes that the first decile includes a lot of tiny stocks that are impossible to buy in practice. These “noninvestable” stocks have outrageously high returns that pull the average for the lowest decile higher. In the fourth edition of the book with data through 2009, he shows that eliminating stocks below $50 million in market cap reduces the microcap return advantage significantly. From 1927 through 2009, the lowest decile excluding noninvestable stocks returns 10.9% , which is just a little higher than the 2nd decile returning 10.6%. Now these are both considerably higher than the 8.8% of the megacaps in the 10th decile, and he agrees that small cap returns are higher; it’s just that microcap returns are only slightly higher than small caps.
To show how noninvestable stocks distort microcap returns, O’Shaughnessy produces some return data from the Compustat database between 1964 and 2009. After removing stocks trading below $1, and limiting monthly returns to 2000%, the stocks with deflated market caps below $25 million returned annual compounded returns of 18.2%. That return is just astonishing. O’Shaughnessy confirms this result using data from the Center for Research in Stock Prices (CRSP), again for sub $25 million stocks, and finds 17.6% compounded returns for the same time period. That’s not bad either. Clearly such high returns will increase the average for the 1st decile, and it’s true that it’s not feasible for most professional investors to purchase these nanocaps.
But I can. In fact, most things I own would be classified as “noninvestable” by Mr. O’Shaughnessy. An alternative lesson to draw from his study is that microcaps are fine but nanocaps are the ticket to wealth; you just have to be poor enough to buy them. Before drawing that conclusion, you need to consider that the world has changed since 1964. For instance, stocks are now traded in decimals, not 1/8ths of a dollar. What was the bid/ask spread on nanocaps trading at $2 in 1968? And are you old enough to remember brokerage commissions before deregulation allowed discount brokers in the 1970’s? It was in the hundreds of dollars per trade and that was when a hundred dollars meant something. You couldn’t pick off a few shares between the bid and ask here and there with multiple trades like you can today. Maybe historically they really were “noninvestable” even for the individual in that trading costs significantly diminished those 18% database returns. If that’s the case, it would be expected that nanocap returns lately might be a lot lower than they were historically. O’Shaughnessy doesn’t address more recent nanocap returns, but that should be easy to check; except that it isn’t. Nobody publishes a nanocap index. In fact, until the recently created LD Micro Index there wasn’t a real microcap index either. If you thought there was, check the average market cap on the Russell Microcap Index. The companies are well over $300 million.
Fortunately, the return data for the 10 deciles going back to 1927 in the CRSP database is now available on the internet. This data has been widely studied, but nobody ever cares much to look at or write about the littlest guys. Only professional investors read investing books that have any sophistication, and most professional investors don’t care about nanocaps; they’re noninvestable. The ones that do care are few in number, and in my experience, a little strange. Kidding, kidding, of course. Write a book or a paper about nanocap returns if you want, but only a few people will read it. But my kids say I’m a little strange myself, so of course I’m intrigued. With all this data now available, what can history teach us about microcap investing in general? Then is the data capable of answering the questions about those outrageous nanocap returns? Are nanocaps the ticket to wealth for the individual investor, or were the high historical returns not realizable in the past and not present in modern data?
Table 1 shows historical returns from the CRSP database for the 10 deciles calculated with each decile members returns equally weighted (i.e. without consideration of market cap).
Table 1: Equally weighted returns and standard deviations of returns for the 10 deciles (1927-2016)
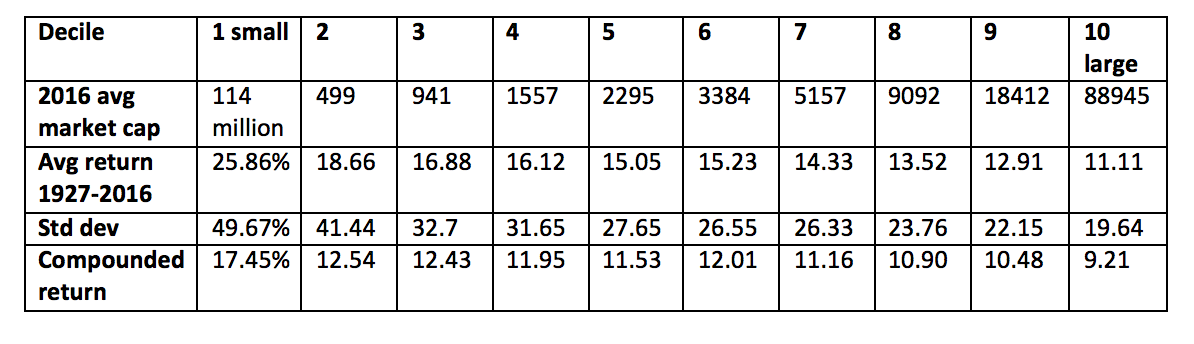
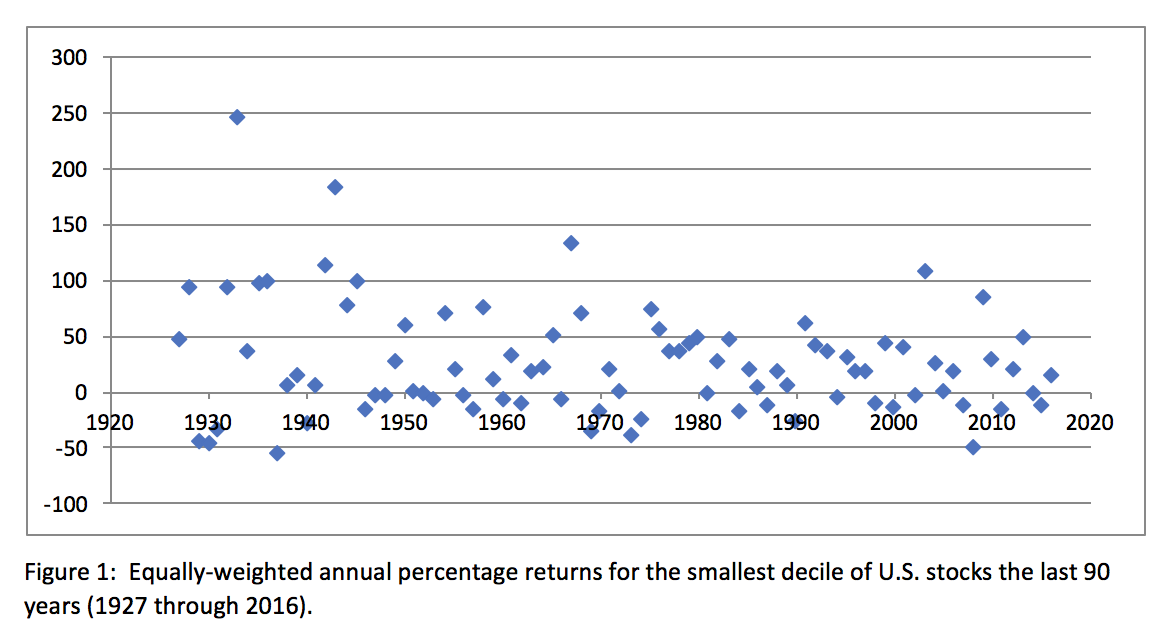
The smallest decile with a year-end 2016 average market cap of $114 million shows the highest compounded annual return at an astonishing 17.44%. It comes with an equally astonishing standard deviation of 49.67%. If the distribution was Gaussian (the normal distribution or bell curve distribution), 68% of years should show returns within one standard deviation of the mean, that is between -23.8% and 75.5%. That means nearly 1 out of 3 years (32%) should be worse than -23.8% or better than 75.5%. Data outside of two standard deviations (-73.5% to 125.2%) should occur in roughly 1 year out of 20. Figure 1 plots the annual returns for each year where you can see that there are 3 years (out of 90) exceeding 125% and four years near -50% including the familiar 2008.
The Figure 1 plot is noisy so some averaging might identify periods where returns were exceptional. Five year compound returns (the year of the data point and the prior four years) are plotted in figure 2a. The returns for the largest decile, which aren’t too much different than the cap weighted S&P 500, are also plotted for contrast.
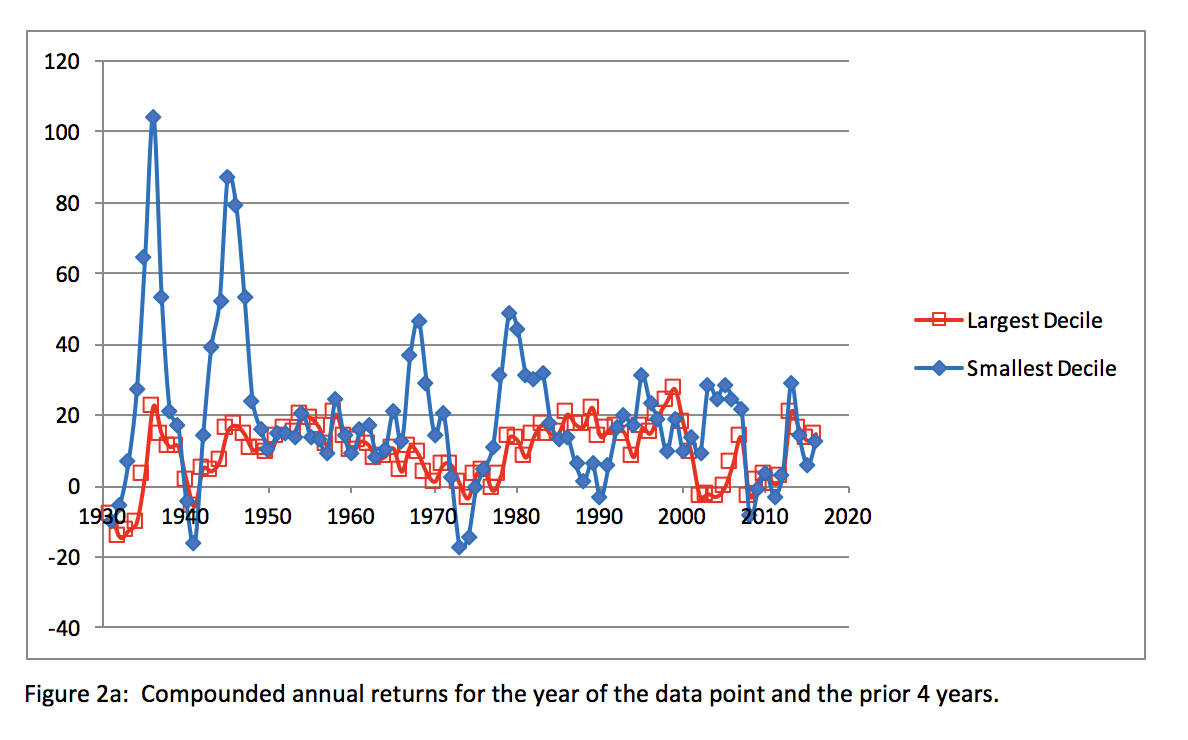
There are several things to note from the plot in figure 2a.
- The smallest decile returns are just wild. In the 1930’s during the depression there was a five year period where the compounded annual return exceeded 100%. Stock prices were up 32 times in five years. After some bad years later in the depression, the microcaps rallied during World War II posting compounded annual returns exceeding 80% in the five years through the end of the war in 1945. A bull market in the 1960’s ended with microcaps appreciating by a factor of four in two years with returns of 134% in 1967 followed by 71% in 1968. Then they roughly cut in half in 1969 (-34.5%) and 1970 (-18.3%) and then did it again in 1973(-39.9%) and 1974 (-23.4%). This was followed by six consecutive years from 1975 through 1980 where the 35.7% return in 1977 was the bad year. The 1980’s showed relatively weak returns for the microcaps as a bull market in the larger stocks raged on. The microcaps played catchup in the early 1990’s and then trailed the big ones again in the late 1990’s as the large-cap technology bubble inflated. The 2000’s saw the bubble pop while the microcaps were posting 5 year returns exceeding 25%. Since the financial crisis, microcap returns have been relatively weak.
- Microcaps are often touted as good diversification tools and figure 2a supports this. The late 1960’s through the early 1980’s showed powerful returns for the little guys while the large caps were in a funk. The 1980’s, late 1990’s, early 2000’s also show high differentiation in returns between the smallest and largest decile. There was a long period in the 1950’s and early 1960’s where the returns are similar and well-correlated. Interestingly, since the financial crisis the big ones and the little ones are moving similarly as well.
- The microcaps appear to go through booms and busts. Choose any data point on figure 2a where returns have been high the prior five years and then count over five data points to see the returns in the subsequent five. They are generally mediocre at best or often just plain bad. Similarly, choose a data point with negative returns and count over five years and you’ll see a big positive number.
What causes the booms and busts? I often read that certain economic conditions favor small companies over large ones. Better for the little ones is high growth economies because small companies can double in size faster than the behemoths. Low interest rates are favorable for the small ones because they need new capital more than mature companies. Inflation somehow is better for small companies than large and that’s why small caps ran like crazy in the late 70’s. I’ll offer no opinion on economic effects, but I would suggest that at least part of the boom and bust is due to investors just being nuts. Once those little guys have rallied a little investors just have to buy them, driving prices higher and higher to excessive levels. Once they’ve fallen or traded directionless for a while nobody needs them and they fall to excessively low levels. John Templeton famously instructed his broker to buy $100 of every stock on the exchange trading for less than $1 in 1939. Checking figure 2a shows that things worked out pretty well for him (80%+ annual returns from 1941-1945). He was buying because he could see that investors had driven valuations outrageously low. Buffet famously closed down his partnership in 1969 telling his investors that there was nothing to buy and recommending they put their money in municipal bonds. This was just before stock prices cut in half twice in 1969-1970 and 1973-1974. Buffet could see that the excessive returns in 1967-1968 were not because of economic conditions; it was a bubble. In the late 1990’s, the large stocks outperformed the little ones significantly. You can see this on figure 2b that shows trailing 12 month returns for the smallest and largest deciles for each month from 1980 through May 2017. The chart shows negative returns for the microcaps in the late 90’s. I started buying microcaps myself about this time and they were very cheap. The general sentiment at the time was that if you owned microcap garbage you should sell those dogs to buy large technology stocks, a dot-com, or an S&P 500 index fund. Economic conditions had nothing to do with microcap underperformance. Then in the early 2000’s you can see on figure 2b that the microcaps were posting 40% twelve month returns. At the same time the largest decile stocks were down 20%. It’s not economics; it’s investors driving microcap prices to excess.
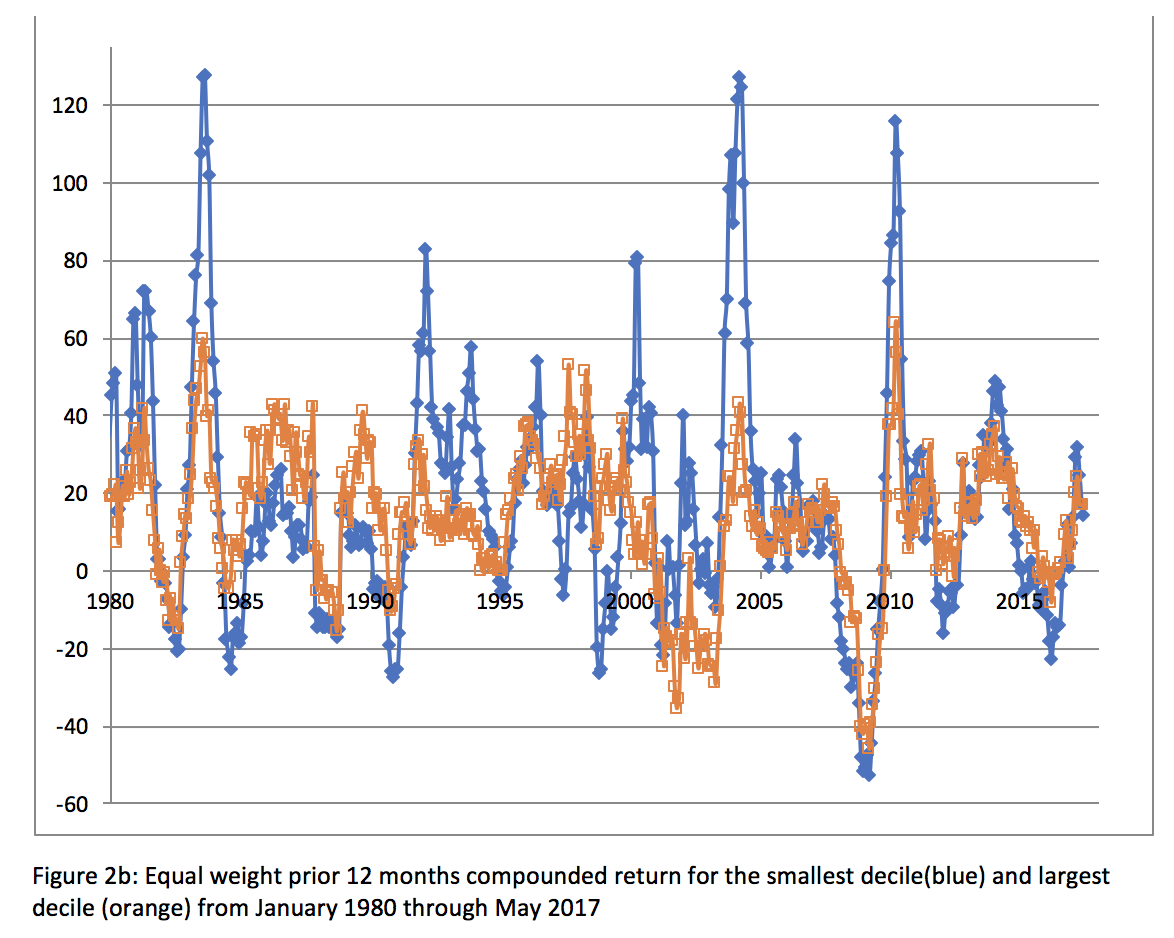
The mid 70’s was the beginning of a six year period (1975-1980) where microcap returns remained high for an extended time. Since then, however, it’s often been the case that high five year returns are actually driven by a big run that happened over just a year or so. This is evident on figure 2b. August 1982 was the beginning of an 11 month rally with returns over 120% that ended swiftly and led into years of microcap underperformance. The high 5 year returns in 1995 of 31.3% were from a three year run in 1991 (61.1%), 1992 (41.7%) and 1993 (36.7%). The high 5 year returns from 2003 through 2007 in figure 2a are from a big 10-month run evident in figure 2b beginning in April 2003 (107.5% for year) and ending in January 2004 (25.0% for the year but 10.7% came in January). The high 5 year return ending in 2013 of 29.0% was from a 14 month run spanning from January 2013 (49.2% for year) through February 2014 (8.5% through February before declining to 0.1% for the year ) coupled with the big but short-lived recovery rally in 2009. You have to be in the stocks through a lot of dull years, often underperforming indexes, while patiently waiting to capture the big run that eventually comes. Those big runs are often sharp (60, 80, 120% in a year) and short-lived.
Figure 3 plots the subsequent five year returns against the preceding five year returns for all the years from 1927 through 2016. The large cap (top decile equal weighted) data points are shown in orange and the microcap (smallest decile equal weighted) in blue.
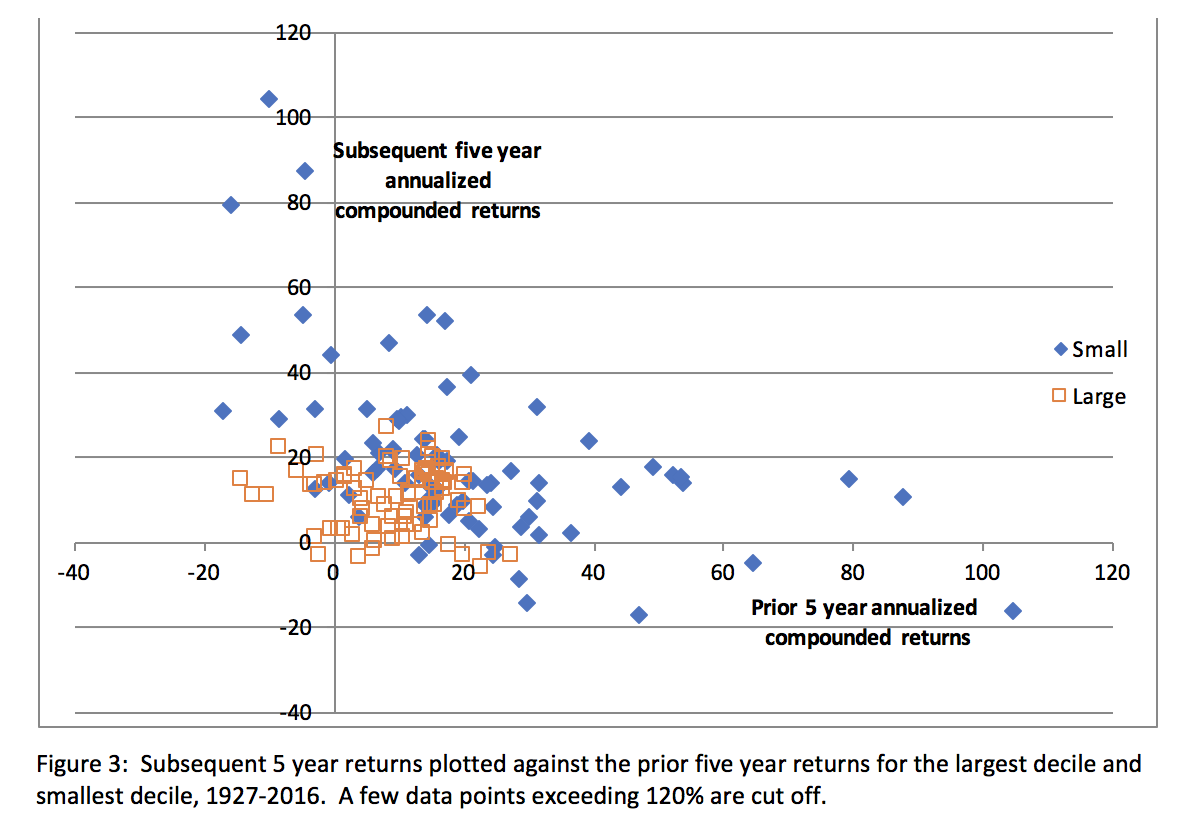
If you drew a best fit line through the orange large company data points in figure 3, it would slope down slightly to the right. That negative slope indicates there is a slight negative correlation. That is, if the large companies past five year returns have been high, the subsequent returns are likely to be lower, but only moderately so. If you drew a best fit line through the blue small company decile data, however, it would slope sharply down and to the right. That is, if the microcaps have done well in the last five years, the outlook for the subsequent five is really bad. If returns have been poor, however, you’re likely to do really well. In particular, if five year returns have been negative, the subsequent five year returns have always been at least in the 20’s and often in the 40’s or 50’s or higher. If there’s anything you take from this article, let this be it: Stocks mean revert; microcaps mean revert like crazy. When performance has been good for a while, it’s almost certain that investors will drive microcap prices excessively high. Big losses or simply an extended period of weak performance will almost certainly result in microcap prices that are excessively low.
The smallest decile had an average market cap of $114 million at the end of 2016, so this decile has a mix of microcaps and nanocaps. O’Shaughnessy notes in the 4th edition of his book with data through 2009 that most of the outperformance of this decile is due to the nanocaps (under $50 million). The CRSP data doesn’t break out returns for anything smaller than the first decile. However, at least some indication of nanocap performance can be extracted from the numbers they do give. The CRSP data calculates the historical returns for each decile on an equal weight basis, but they also provide returns on a market cap weighted basis. Table 2 shows the historical returns for each calculation method for the smallest decile dating back to 1927.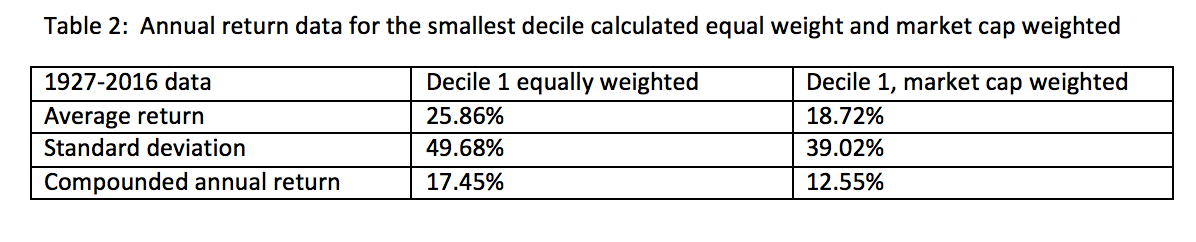 Weighting by market cap results in return data that reflects the larger stocks, the microcaps, more than the smaller nanocaps. The result is a reduction in the compound annual return from 17.45% down to 12.55%. The nanocaps clearly are responsible for the outperformance consistent with What Works on Wall Street. Table 2 data doesn’t exclude the nanocaps but merely underweights them resulting in a return reduction of 4.9%. For now on, I’ll refer to the decile 1 returns that are market cap weighted as the “microcaps” and the equal weighted data as the “nanocaps”. We’ll generally see that the nanocap returns are higher than the microcap returns. Keep in mind that in reality, the nanocap outperformance is higher than the numbers show. There are some microcaps in the nanocap data that reduce the nanocap returns and some nanocaps in the microcap data that increase the microcap returns. Notice in table 2 that associated with the higher nanocap returns is a higher standard deviation. If standard deviation of returns is your measure of risk, then the nanocaps are riskier.
Figure 4 plots the historical annual returns of the nanocaps verses the microcaps. You can see that many years show higher returns for the nanocaps. As one might expect, the nanocap outperformance is high when the returns are high. Apparently when investors start chasing, they chase the nanocaps higher than they chase the microcaps. What is interesting, however, is that when returns are poor the nanocaps aren’t worse. In fact, in the depression the nanocaps were considerably better. In the latest meltdown in 2008, however, the nanocaps did underperform but made up for it quickly in the up move in 2009. Nanocap performance that is even with, or better than, the microcaps in down markets is surprising. Is this characteristic of nanocaps exclusively or rather some statistical phenomenon that is present in all the deciles? The 2nd decile shows just a hint of this behavior (equal weight better in up markets but not worse in down markets). It was much less pronounced than the 1st decile, however. The same comparison on the 7th decile didn’t show this behavior at all. Perhaps this is characteristic of the tiniest stocks or perhaps it’s just chance. The number of down-year data points is too limited to draw any solid conclusion.
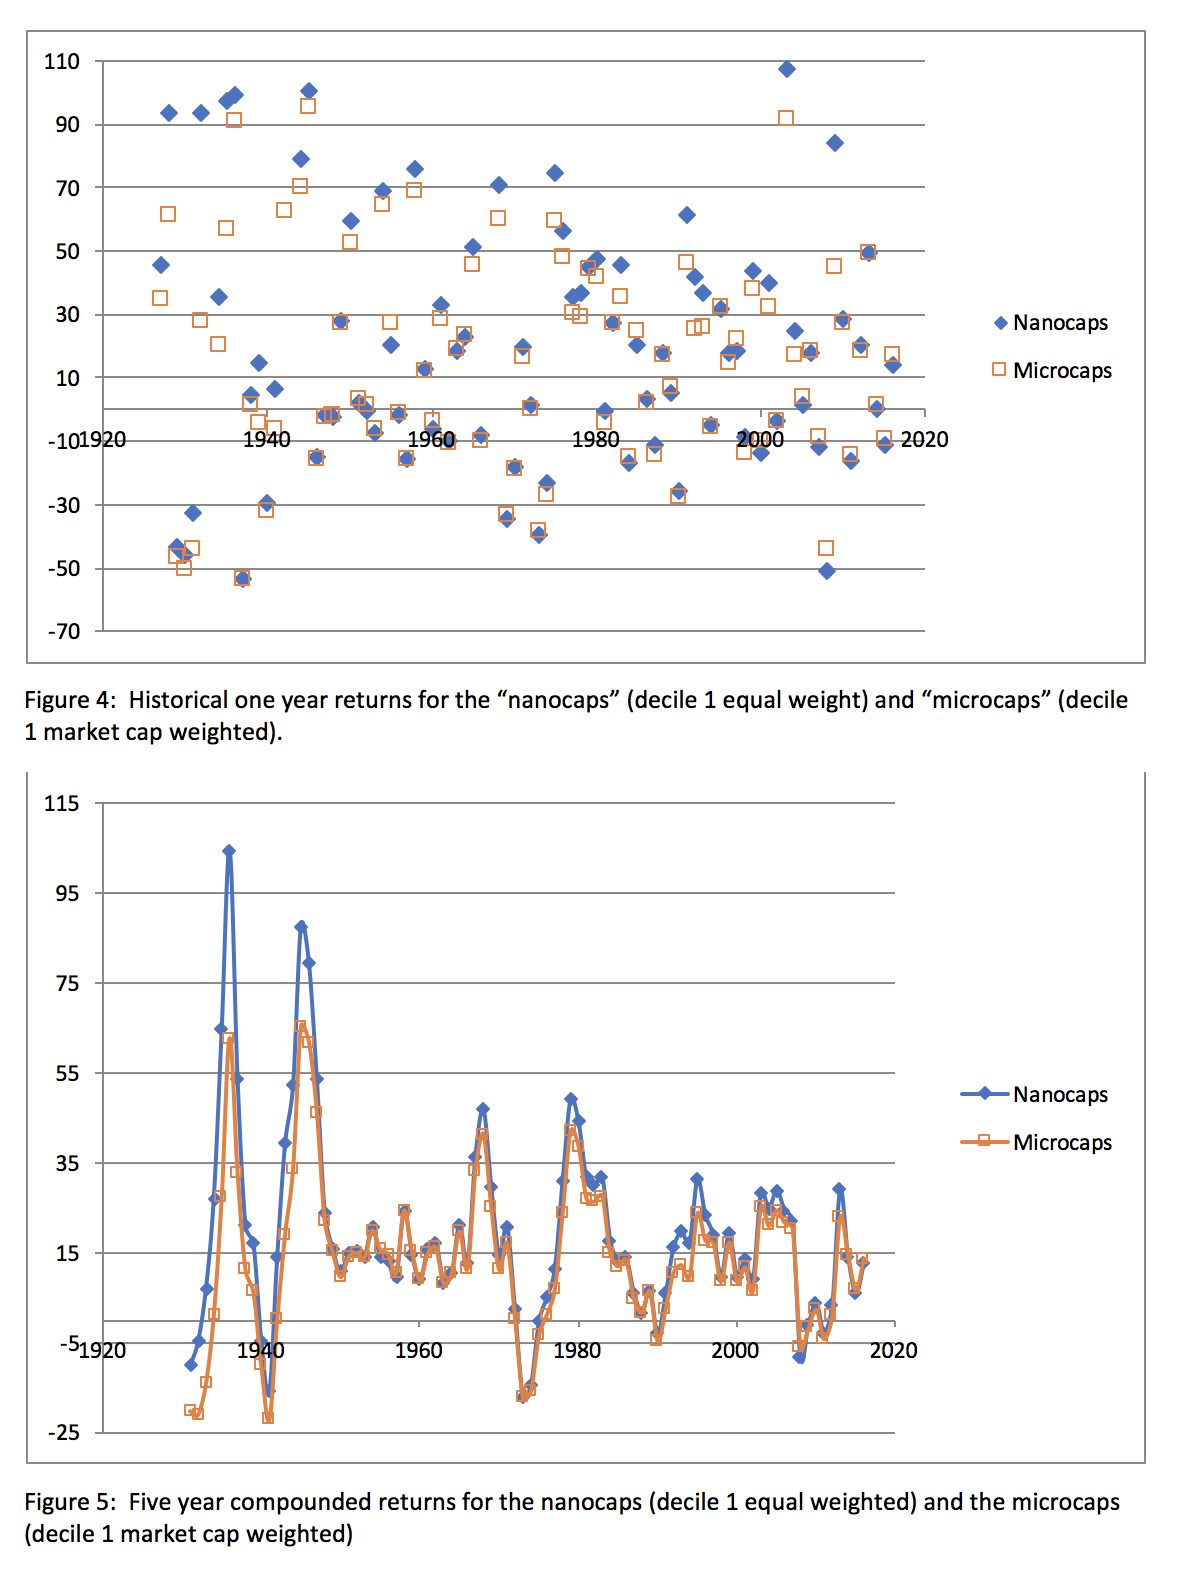 Figure 5 plots the five year compound annual return of the nanocaps and the microcaps. The outperformance of nanocaps in bull markets is evident. With the exception of 2008, there isn’t any significant underperformance in bear markets. It’s true that the standard deviation of returns is higher for the nanocaps, but that’s coming from insanely bigger up years and generally not from bigger down years. If the chance for a big loss is your idea of risk, then nanocaps don’t appear to be riskier than microcaps, at least not historically. The exception is 2008 where the nanocaps dropped 50.7% rather than the microcaps return of -43.7%.
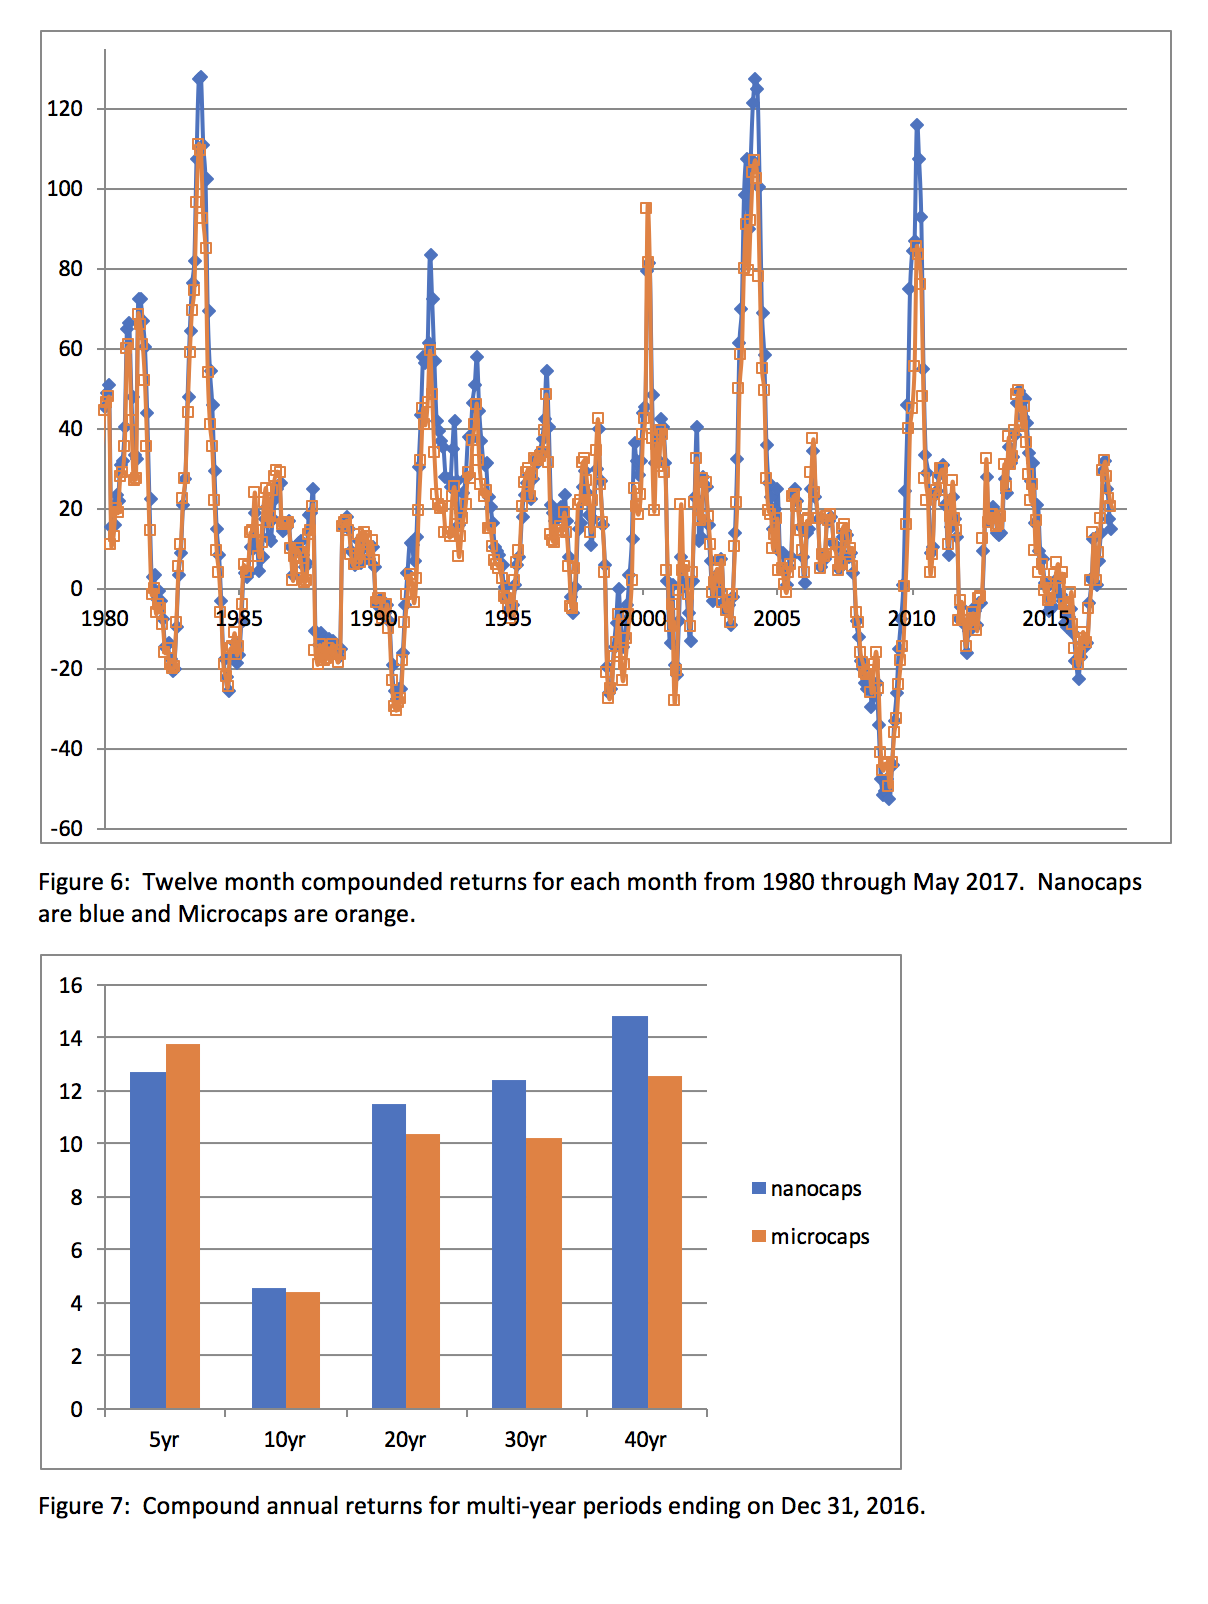
Figure 6 was created from monthly returns in the CRSP data. To smooth out noise, the compounded returns for the trailing 12 months are calculated and plotted for each month from 1980 through May 2017. Note that the outperformance of nanocaps in bull markets is still present in modern data after trading costs have fallen. Overall outperformance of nanocaps over microcaps continued all through the 1990’s and through the 2000’s. Beginning in 2007, leading into the financial crisis, they underperformed (-12.1% vs -8.8%) and nanocap outperformance hasn’t yet resumed. Compounded returns for the last 5, 10, 20, 30, and 40 years are shown in Figure 7.
 The January effect is well-known; smaller caps tend to outperform larger caps significantly in the first month of the year. Does the data confirm that microcaps outperform large caps in January? Has that trend continued into modern times? Yes is the answer to both of these questions. Microcaps outperformed large caps in 72 of the 90 years from 1927 through 2016. The average return for microcaps was 6.2% higher than large caps (decile 10 equal weighted). The January effect for microcaps is much weaker in the last 30 years, however, averaging just 2.8%. This year (2017), microcaps underperformed large caps by 2.4% in January.
Nanocaps (1st decile equal weighted) have outperformed microcaps (1st decile market cap weighted) in the month of January every year since 1927, the only two exceptions being 1952 and 1955. The average outperformance is 2.8%. In the last 30 years ended 2016, the nanocap performance advantage has been a little higher, averaging 3.2% in the month of January. Note in figure 7 that the performance advantage of nanocaps over microcaps the last 30 years has only been about 2.2% for the whole year, so nanocaps have outperformed in January and underperformed for the remainder of the year. In January 2017, nanocaps outperformed microcaps by 3.1%, but through May have given back all the advantage.
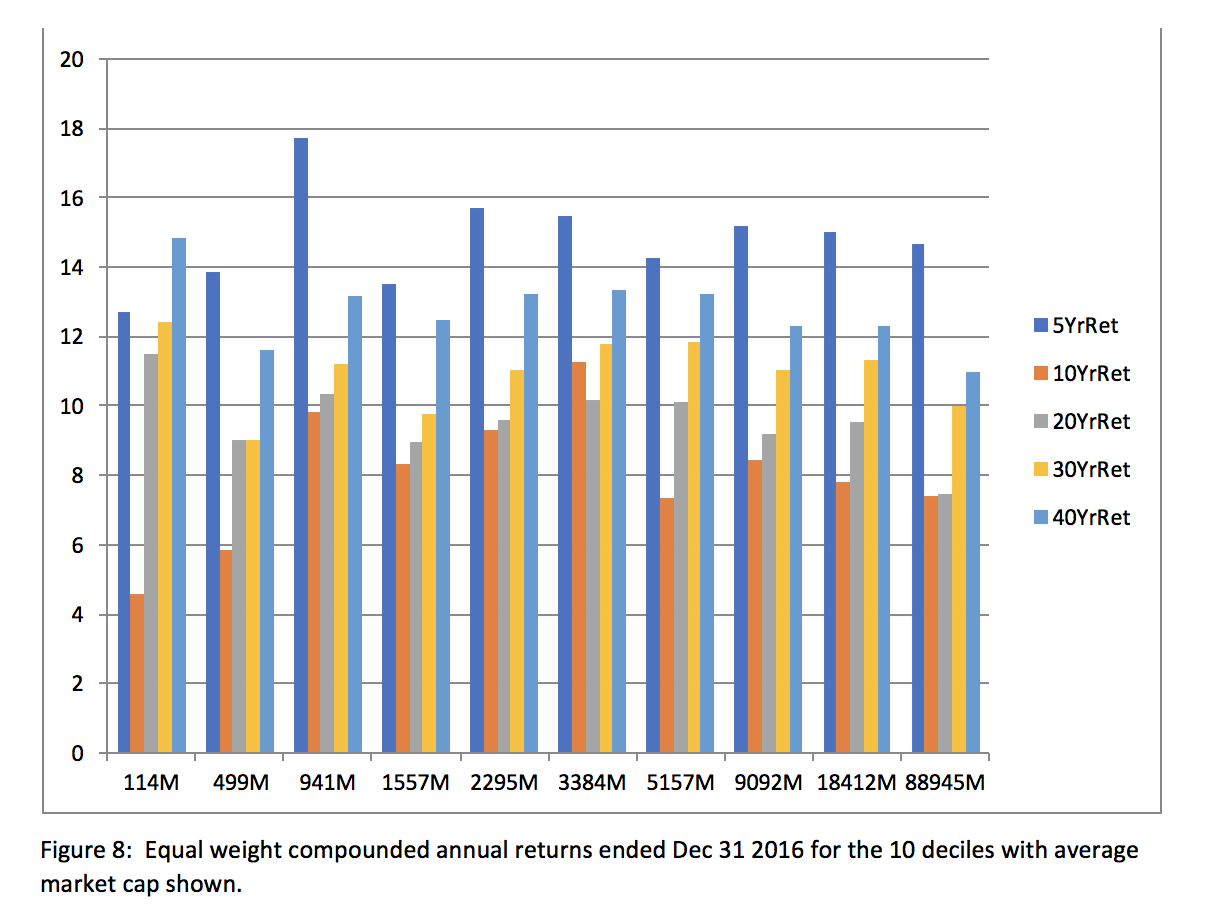
Figure 8 shows the compounded annual returns for the 10 deciles in recent years. The smallest decile has a long history of outperforming all others by a wide margin dating back to 1927. They have outperformed in the last 20, 30, and 40 year periods ended Dec 2016 as well. Recently, however, the returns have been relatively poor. Decile 1 has the worst returns in the last 5 year and 10 year periods. This year (2017) through May is no better; the nanocaps have returned 0.9% vs 9.0% for the largest decile. There’s almost no difference between the nanocaps and microcaps in 2017, and the general trend across the deciles this year is that bigger is better. If you’re a microcap investor and it seems like it’s been tough to make money lately you’re not alone. In light of the discussion on microcaps strongly mean-reverting, this should be encouraging. However, we’ve seen that microcaps can just drift around underperforming for years before running like crazy. The hope is that knowing they behave this way will inspire patience.
A summary of the findings in this historical study follows:
- Microcap returns historically have been “wild” with periods of incredible returns sometimes followed by very bad years or years of low returns. The returns are less wild lately, but are still violent (107% in 2003, -50.7% in 2008, 84.4% in 2009, 49.2% in 2013).
- Returns on microcaps have been strongly mean-reverting historically. A period of high 5 year returns is generally followed by poor subsequent 5 year returns.
- Microcap returns are often differentiated a great deal from large cap returns. Since the financial crisis they’ve been more closely correlated however.
- Nanocap returns are much higher historically than microcap returns. Nanocaps appear to run higher when the little ones run up but don’t fall more when they come down. This outperformance has persisted into modern times but the magnitude is not as high as the historical numbers.
- In the last decade the microcaps and nanocaps have performed about the same. This performance is significantly worse than all the other market cap deciles. Nanocaps have underperformed microcaps in the last five years.
- Microcaps outperform large caps in January of most years. The average magnitude back to 1927 is much larger than in the last 30 years, however. Nanocaps reliably outperform microcaps in January and have continued to in recent years.
So what’s the outlook for microcaps? The Center for Research on Stock Prices doesn’t have any data on the future, so I’m left to speculate. I think microcaps will likely continue to outperform in the long run because they usually trade at a liquidity discount. I speculate that they eventually realize the higher valuations of their larger brethren either by growing to a larger size or getting bought out, hence their higher returns. The current love of indexing and indexed ETF’s in particular reminds me of the love of S&P 500 index funds in the late 1990’s. The big stocks had outperformed in the 1990’s. Investors really just buy what’s done well recently so index funds were all the rage. Microcaps today are underperforming similarly to the mid to late 1990’s. My guess is they’ll continue to underperform until the big stocks get hit. Then the microcaps will outperform and, when fear subsides, go on a run that makes up for all the underperformance and then some.
Are Nanocaps the ticket to wealth? Nanocap outperformance over microcaps has disappeared in the last decade. This isn’t new as there wasn’t much excess return for the nanocaps in the 1950’s either. Nanocap outperformance came back in the late 60’s and 70’s and then disappeared again in the weakly performing 1980’s. It returned again in the 1990’s and 2000’s and this was after spreads and trading costs were reduced. I suspect the big return numbers in the past for nanocaps partly reflected historical trading costs, but partly an illiquidity discount as well. The illiquidity discount remains. The recent underperformance may reflect that discount widening as investors sell individual stocks and buy ETF’s. It would be no surprise if that discount continues to widen for a while longer, but financial value wins in the end. Eventually the nanocap stocks will realize higher multiples facilitated by growth, buyouts, or another microcap run. When that next microcap run comes, the nanocaps will run too, but higher.
An enterprising investor can build wealth for themselves investing in nanocaps. The high average return is the wind at your back, but the wind comes and goes and sometimes blows in the wrong direction. To build wealth steadily, an investor must make at least some return even when there is no breeze. Fortunately, the nanocaps lie in the least efficiently priced subsector of the least efficiently priced decile. Pick some stocks.
By Mark Vonderwell, Edited by Cara Vonderwell
===> Interact and learn with 250+ of the best microcap investors on the planet. [Join Us]
MicroCapClub is an exclusive forum for experienced microcap investors focused on microcap companies (sub $500m market cap) trading on United States, Canadian, European, and Australian markets. MicroCapClub was created to be a platform for experienced microcap investors to share and discuss stock ideas. Since 2011, our members have profiled 1000+ microcap companies. Investors can join our community by applying to become a member or subscribing to gain instant view only access. MicroCapClub’s mission is to foster the highest quality microcap investor Community, produce Educational content for investors, and promote better Leadership in the microcap arena. For more information, visit http://microcapclub.com and https://microcapclub.com/summit/