iShares Microcap ETF (IWC) – A Benchmark that is Not Very Microcap
The IWC underweights the highest performing group, microcaps that are profitable & growing earnings.
My name is Ryan Telford and I'm the new Head of Evidence Based Research at MicroCapClub.
What is Evidence Based Research? Instead of guessing and letting biases influence my investing, I look at evidence, and facts. I use a historical databases of accurate data that can be measured consistently over time. This includes, but is not limited to, financial statement data, price and volume data, analyst data specific to stocks, and to a lesser extent even macro data sets.
I've been highlighting my findings on the community. To view, join us:
The iShares Microcap ETF (IWC), is generally accepted as a benchmark for microcaps, and is available for investors to get some microcap exposure, should they prefer not to pick their own.
But as we will see, there are several features of this ETF that may suggest it is not an ideal microcap benchmark.
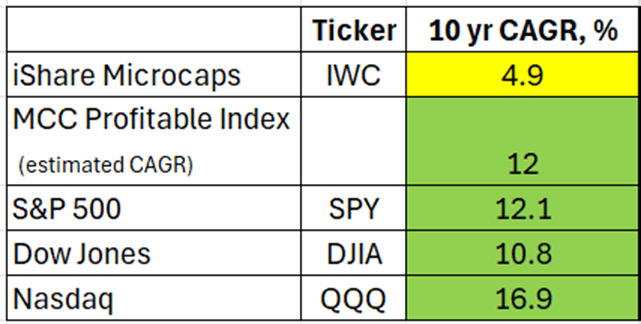
First off, performance of this ETF has underperformed large cap indices, and even other microcap performance metrics, by a wide margin. While larger cap indices, and the MCC Profitable Index (MCCPI) have enjoyed double digit CAGR over the last 10 years, IWC has managed less than 5% CAGR.
Let’s dig in.
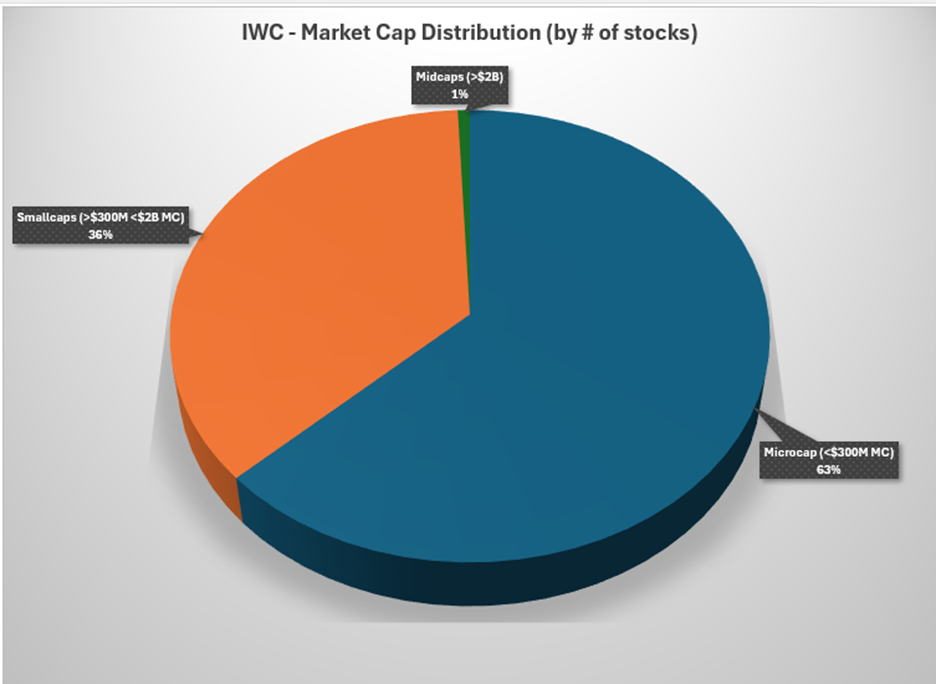
First off, while the iShares Microcap ETF is "microcap" in name, the actual make-up is different.
Roughly 2/3 of the index is made up of microcap stocks (<$300M market cap), while the remaining 1/3 of stocks are mostly large smallcaps.
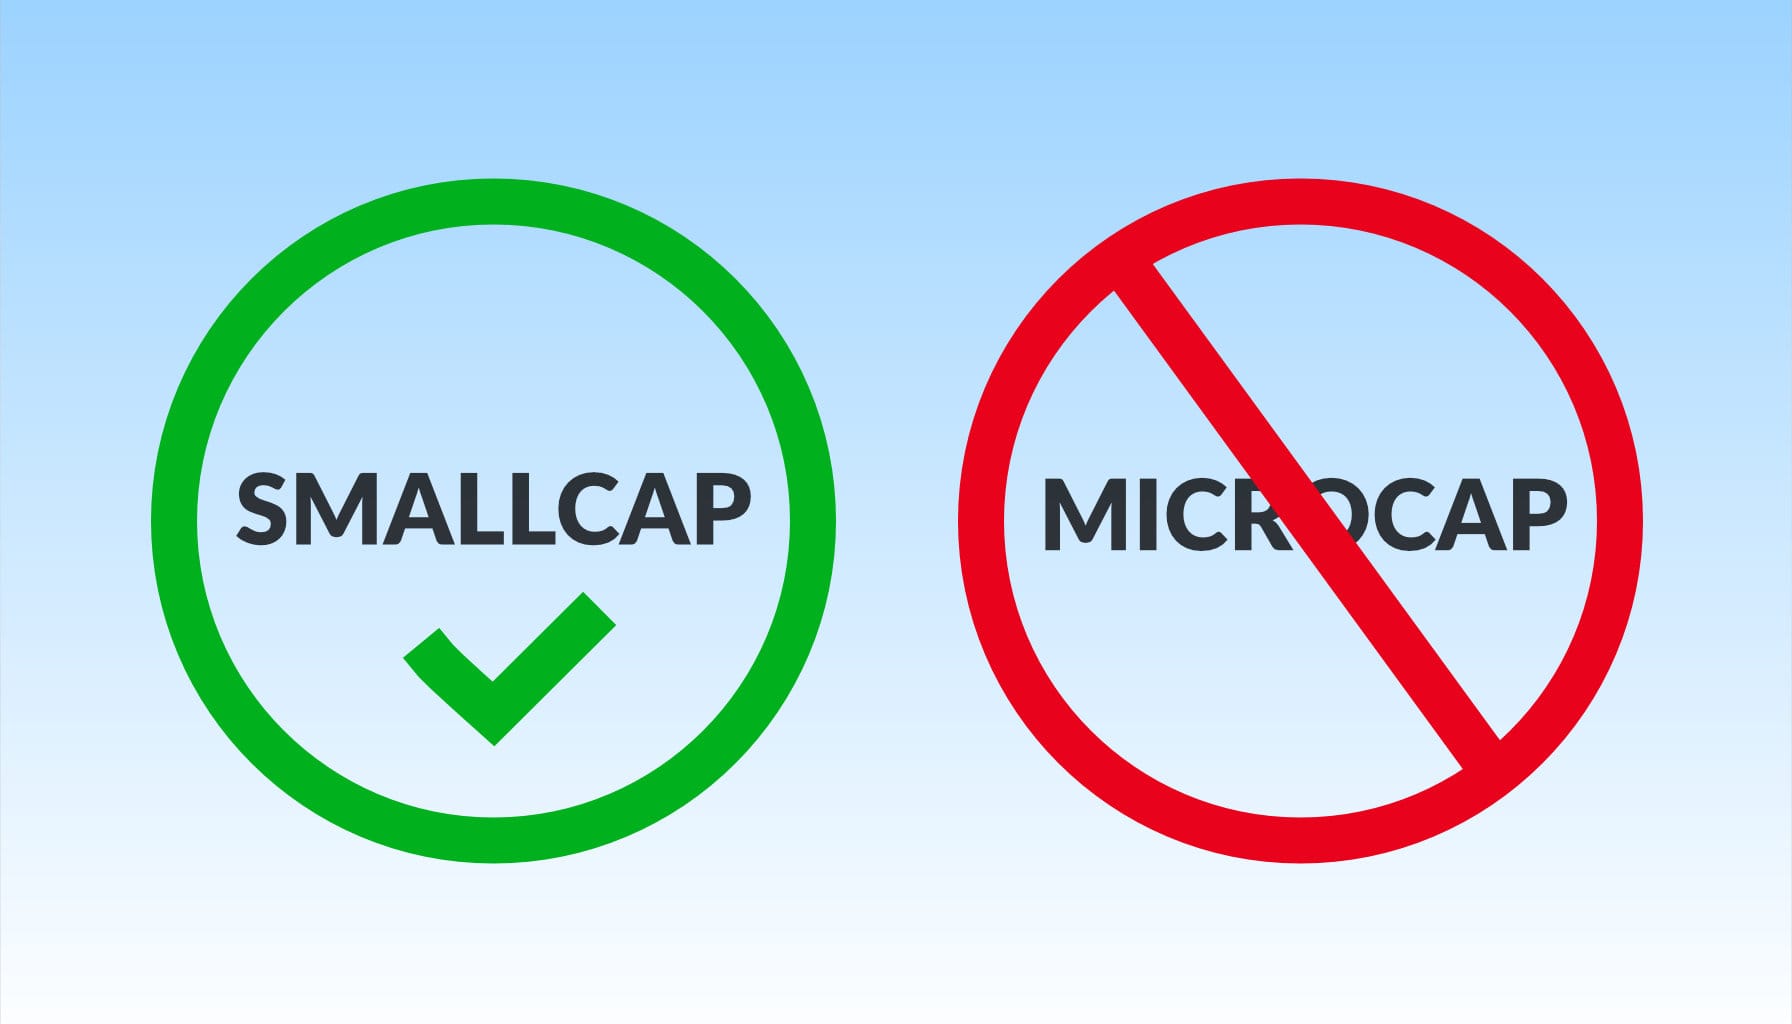
At first glance, the difference between microcap and smallcap may not seem that significant. But put in perspective, in some cases the difference can be more than an order of magnitude.
Here are the 10 largest holdings currently in IWC:
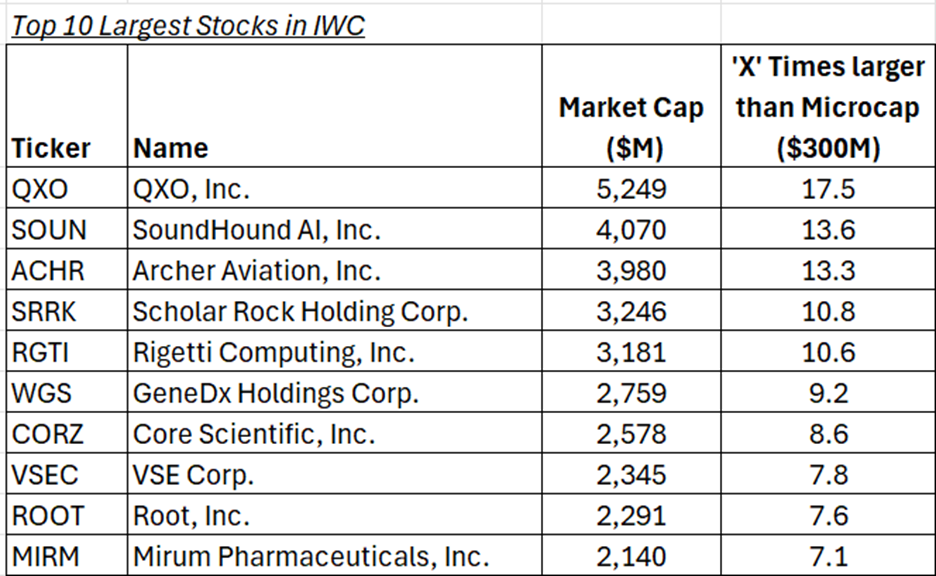
The top 5 holdings are >10X the maximum microcap size.
As IWC is market cap weighted, those larger stocks will receive a larger weight in the index.
If we take total aggregate market cap by size group (a proxy for cap weighting), in microcap, smallcap and midcap, we see a significant difference in weighting, with smallcaps making up about 2/3 of the index.
(Note that this may not reflect the actual weighting of IWC, as this is a simple proportion of total market cap by size group.)
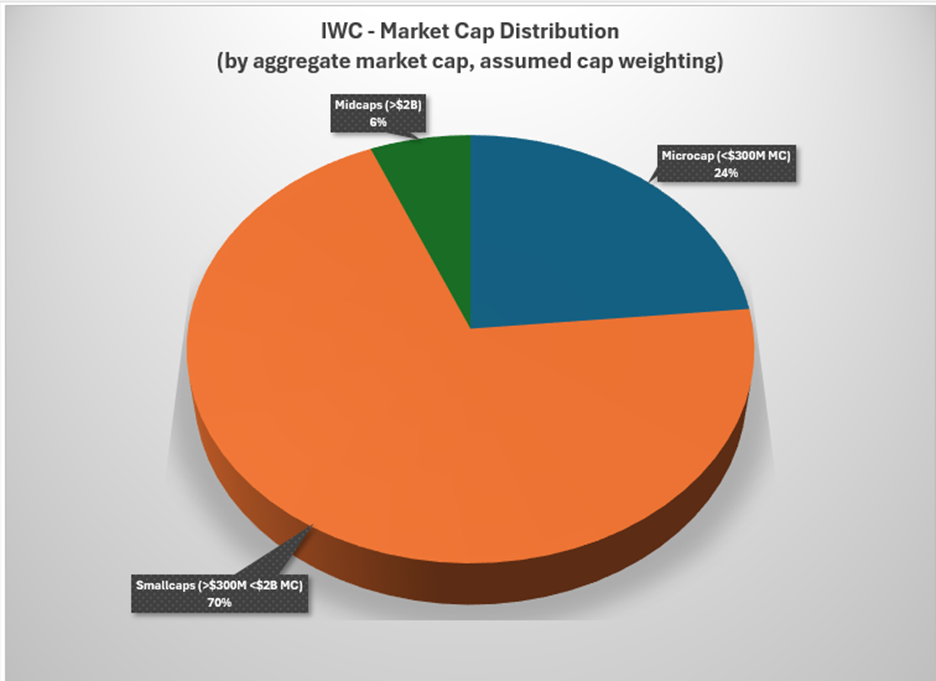
Even with different approaches, this microcap benchmark index does not appear to be all that microcap.
Next up, what is the sector distribution in IWC? More than 50% of stocks are in healthcare or financials.
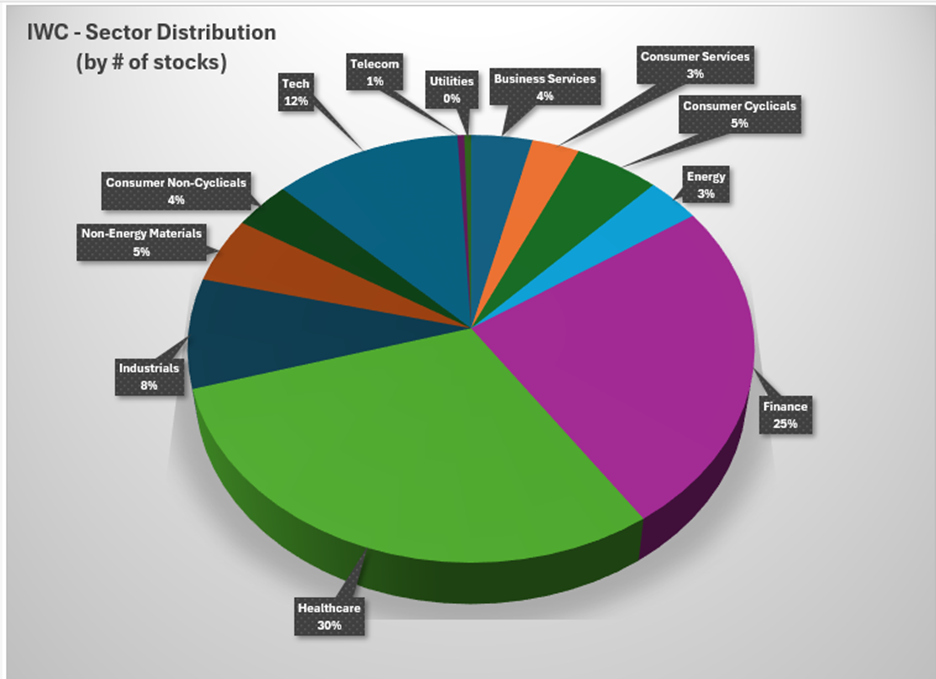
Using the same market cap weighting approach, the sector distribution does not vary significantly from just the number of stocks.
At first glance, the sector weighting appears to overweight recent underperformers (healthcare/biotech), but underweight outperforming sectors (technology stocks).
Let’s break it down further. Recall from our Microcaps Roadmap on our community, we looked at various categories of microcaps:
- With/without sales
- Growing/shrinking sales
- Profitable/unprofitable
- Profitable + growing earnings v/s unprofitable + shrinking earnings
For all US microcaps, performance of each group has been as follows:
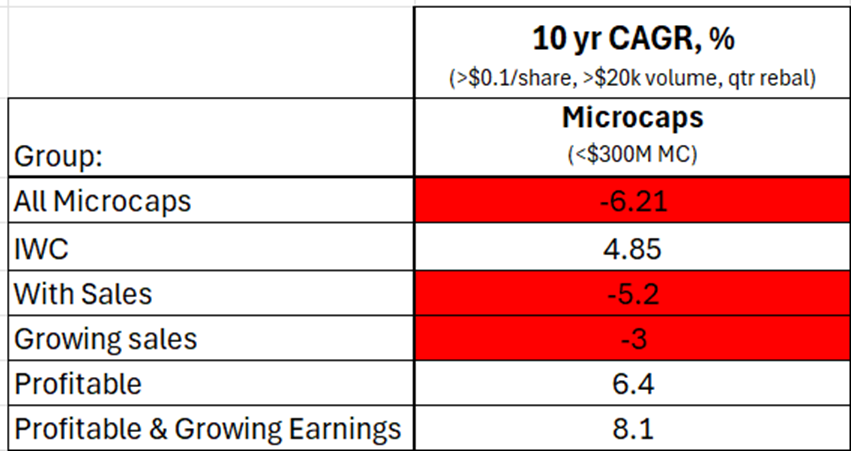
On the one hand, IWC has outperformed microcaps broadly, however has underperformed the higher quality microcap groups of profitable and profitable + growing earnings.
When we breakdown IWC by these groups, we see that it is underweight the most high performing group, “profitable & growing earnings”:
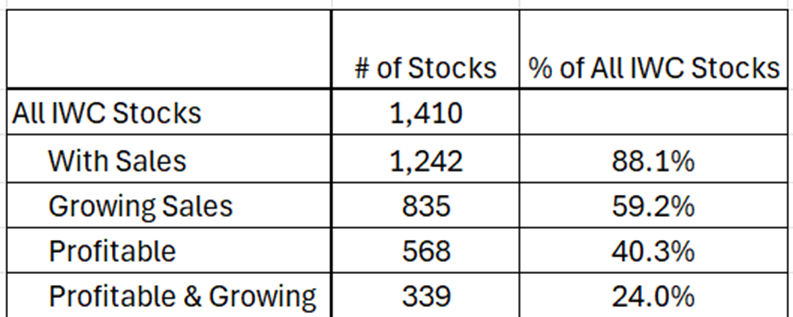
It is also notable that only 40% of the holdings are profitable.
And by sector:
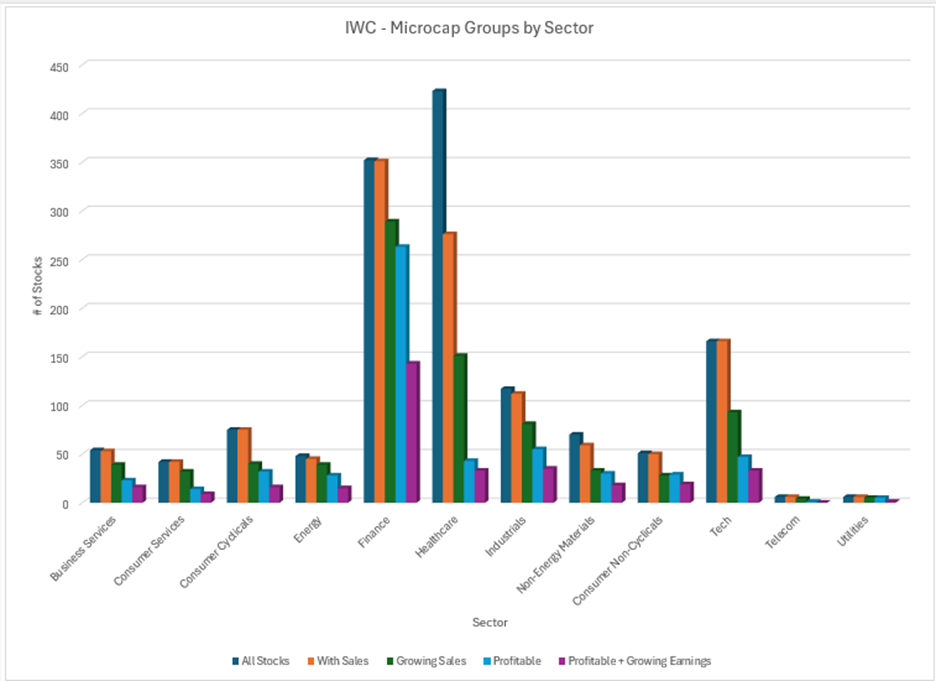
Finance and Healthcare represent more than 50% of all IWC holdings, with finance holding its own in terms of most profitable and profitable+growing, however healthcare includes the least proportion of these higher performing groups.
Comparing one’s own performance to a benchmark is important – to gauge whether he additional effort in stock picking or using another custom strategy is able to generate alpha. However it is key to understand what the benchmark represents, to ensure an apples-to-apples comparison.
From the data above, IWC has several characteristics that may not be similar to how many microcap investors actually invest.
If using IWC as a benchmark, at least we know how performance may be different than our own strategies.
Interact and learn with 250+ of the best microcap investors on the planet:
Disclaimer: All content in this newsletter is for discussion, education, entertainment, and illustrative purposes only and SHOULD NOT be construed as professional financial advice, solicitation, or recommendation to buy or sell any securities, notwithstanding anything stated on this newsletter and MicroCapClub.com. There are risks associated with investing in securities. Loss of principal is possible. Past performance is not a predictor of future investment performance. Ian Cassel, Ryan Telford and MicroCapClub.com are not responsible for investment actions taken by viewers. Should you need such advice, consult a licensed financial advisor, legal advisor, or tax advisor. You agree to verify all information yourself before investing. Any past performance discussed on MicroCapClub.com is no guarantee of future results. Investing involves risk and possible loss of principal capital; please seek advice from a licensed professional. All views expressed are personal opinions as of the date of publication and are subject to change without the responsibility to update views. No guarantee is given regarding the accuracy of the information. FULL DISCLAIMER and TERMS OF USE
MicroCapClub is an exclusive forum for experienced microcap investors focused on microcap companies (sub $500m market cap) trading on United States, Canadian, European, and Australian markets. MicroCapClub was created to be a platform for experienced microcap investors to share and discuss stock ideas. Since 2011, our members have profiled 1200+ microcap companies. Investors can join our community by applying to become a member or subscribing to gain instant view only access. MicroCapClub’s mission is to foster the highest quality microcap investor Community, produce Educational content for investors, and promote better Leadership in the microcap arena. For more information, visit https://microcapclub.com/ and https://microcapclub.com/summit/