Should I Buy the Dip After a 60% Drawdown?
Do microcaps that experience deep drawdowns eventually recover? What about stocks that have strong fundamentals after the drawdown - are these potential buying opportunities?
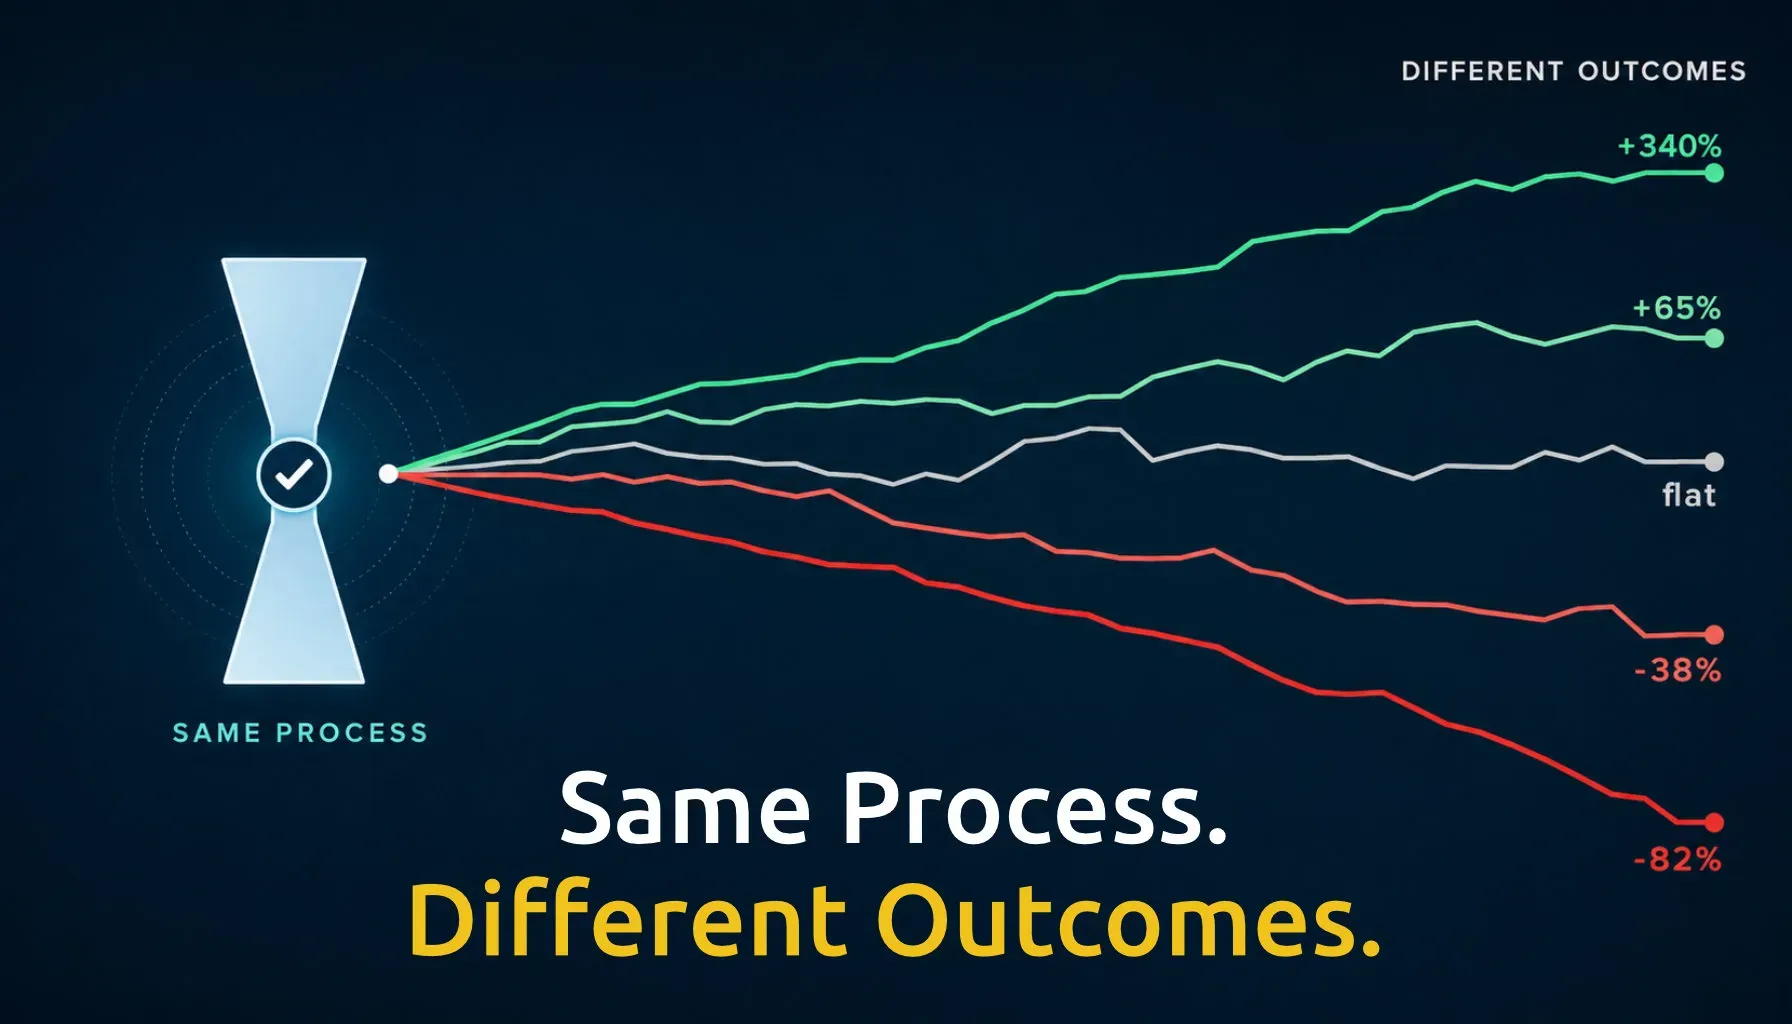
Most microcap investors are aware of the volatility that comes with the asset class - market beating returns on the upside, and deep drawdowns on the downside.
Downside volatility can be difficult, but at times can provide buying opportunities (aka “buy the dip”). But not all drawdowns are created equal - some are temporary, and others are longer term, or even permanent.
In an article I wrote last week,“Average Up, or Average Down?" (exclusive to MCC Members/Subscribers), we saw that microcaps tend to outperform near their highs, or on mild pullbacks (10-30% drawdown from their highs). Deeper drawdowns, on the other hand, resulted in weaker future 1 year returns.
Some readers asked the natural follow-up: what happens over longer time horizons?
Do microcaps that experience deep drawdowns eventually recover? And if so, what about those stocks that have strong fundamentals after the drawdown - are these potential buying opportunities?
Let’s look at the data.
Deep Drawdown Data
In the previous piece, we looked at various depths of drawdown. For this piece, we’ll focus on the deepest drawdown group, those with 1 year drawdowns of 60% or more, or a “collapse”.
We’ll look at future returns of 1, 3, 5 and 10 years after the collapse, both broadly at all microcaps, and also importantly at those with fundamental strength the year of the drawdown, specifically those stocks that are profitable, and that are growing sales.
Important to note: this is a very small sample. From 2012 to 2025, the median number of collapse stocks with fundamental strength is just 12 per year — and fewer in some years. Results can be influenced by outliers, so interpretation should be done with appropriate caution. For this reason, median values are used throughout.
See the basis of the test below.
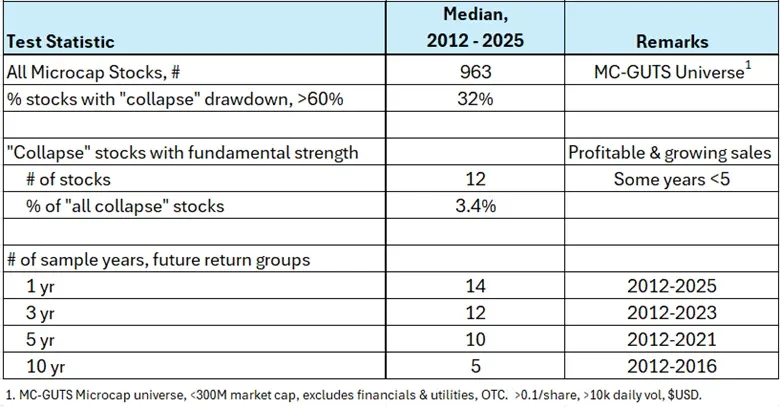
Notable here that nearly 1/3 of microcaps experience a collapse drawdown of 60% per year. And of those, only 3.4% still have fundamental strength, being both profitable and growing sales.
Most “Collapse” Microcaps Do not Recover
The chart below shows median future returns of our deep drawdown microcaps (“collapse”, -60% 1 year drawdown or more), in the future 1, 3, 5 and 10 years after collapse.
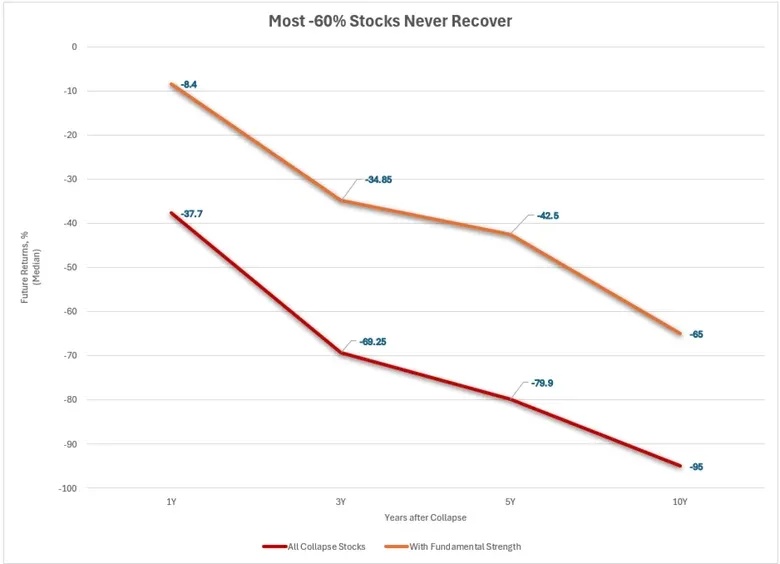
As the chart illustrates, future returns continue to deteriorate for our group of “collapse” microcaps (red line), from -38% in the next near, to -95% in 10 years.
Even those stocks with fundamental strength at time of collapse (profitable and growing sales, orange line), future returns improve compared to all collapse microcaps, but are still negative and quite deep.
Survival Rates
Of those collapse microcaps with fundamental strength, a meaningful percentage do not survive long term. This is due to several factors, mostly due to delistings, bankruptcies, mergers, and in a minority of cases the stock exiting the microcap universe.
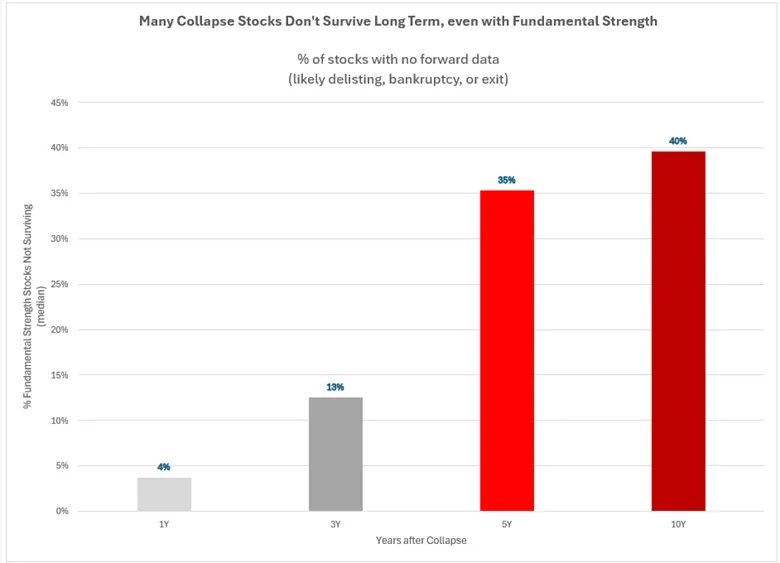
Survival rates decline meaningfully over longer time horizons, with roughly 40% of collapse stocks no longer in the universe after 10 years.
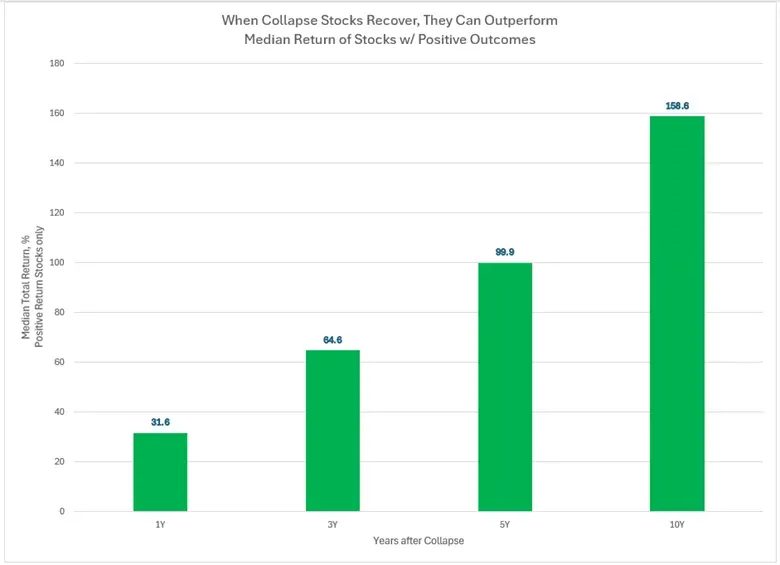
Winners Win
Median values describe the overall group, but they obscure an important subset: the winners.
Below we see overall median returns of those stocks with fundamental strength, that managed to post positive future returns.
As an example, 5 years after the collapse, winning stocks posted a return of nearly 2X (99%), and 2.5X after 10 years.
We are talking a small subset of stocks that posted positive returns. In the chart below, we see median % of stocks with fundamental strength, also with positive returns (blue line).
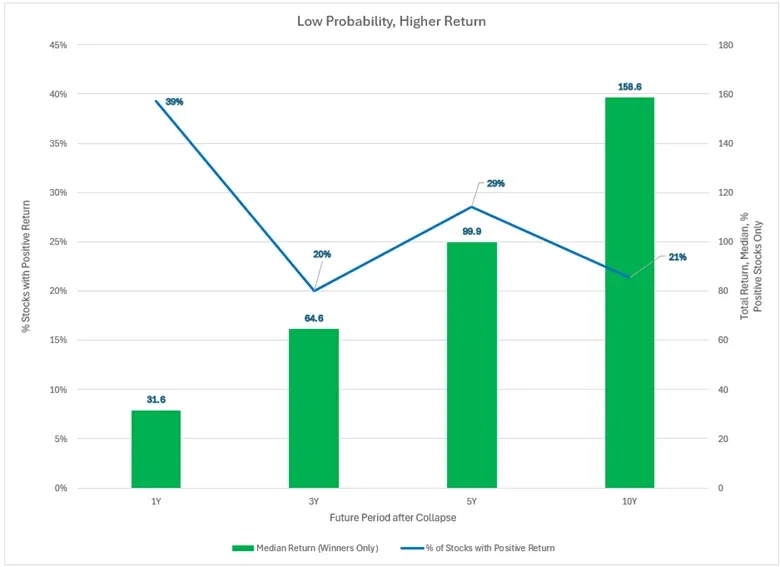
As can be expected, the proportion of winners trends downwards over time, with 39% of collapse stocks being winners after 1 year, but trending down to 21% over 10 years.
It should be emphasized that overall we are looking at very few stocks that fit this category. Recall from the first table that the median number of “collapse” stocks with fundamental strength is only 12 stocks. This is a tiny number, but these stocks do exist, and pose potential returns for those investors willing to find them.
Deep Drawdown Microcaps - Dead Money, or Long Term Opportunity?
Deep drawdowns in microcaps are rarely a signal of opportunity on their own.
On average, the data shows that most “collapse” stocks continue to underperform, and a meaningful percentage don’t survive at all.
But the story doesn’t end there.
A small subset of companies, particularly those that maintain fundamental strength, do recover. And when they do, the returns can be significant over multi-year periods.
The challenge, of course, is that these winners are few and difficult to identify in real time.
For investors, this reinforces an important point:
“Buy the dip” should not be a strategy in microcaps, but rather a starting point. Not all drawdowns are created equal.
In microcaps, a 60% decline is often a warning sign — but in select cases, it can also mark the beginning of the next cycle.
*** If you found this research helpful, please share it and also join our community to view 30+ other articles I've written.
Interact and learn with 250+ of the best microcap investors on the planet:
Portfolio123 – All data and quantitative tools used for this piece, and all pieces in the Evidence Based Forum, provided by Portfolio123. If you’d like to try Portfolio123 with an extended free trial (35 days vs the typical 20 days), check out this link, or use Invitation Code “RYANT” (full disclosure, affiliate link). I’m available for any questions you may have.
Note: Past performance is not an indicator of future results. Please visit our Terms of Use for a more complete disclaimer and discussion of the risks of investing.